Computer Hardware Reseller Business Plan
AMT Computers
Executive Summary
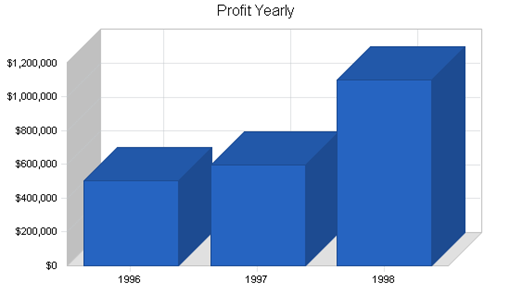
By focusing on its strengths, its key customers, and the underlying values they need, American Management Technology will increase sales to more than $9 million in three years, while improving the gross margin on sales and cash management and working capital.
This business plan leads the way. It renews our vision and strategic focus: adding value to our target market segments, the small business and high-end home office users, in our local market. It also provides the step-by-step plan for improving our sales, gross margin, and profitability. In order to implement these changes and improve profitability, we plan to borrow another $100,000 long-term this year. The amount seems in-line with the balance sheet capabilities.
AMT is built on the assumption that the management of information technology for business is like legal advice, accounting, graphic arts, and other bodies of knowledge, in that it is not inherently a do-it-yourself prospect. Smart business people who aren't computer hobbyists need to find quality vendors of reliable hardware, software, service, and support. They need to use these quality vendors as they use their other professional service suppliers, as trusted allies. AMT seeks to fulfill these needs and become the leader in business information technology for its region.
AMT provides both computer products and services to make them useful to small businesses. We are especially focused on providing network systems and services to small and medium business. The systems include both PC-based LAN systems and minicomputer server-based systems. Our services include design and installation of network systems, training, and support.
In order to accomplish our objectives, our keys to success over the next three years are:
- Differentiate from box-pushing, price-oriented businesses by offering and delivering service and support--and charging for it.
- Increase gross margin to more than 30%.
- Increase our non-hardware sales to 20% of the total sales by the third year.
AMT was founded as a consulting-oriented value added reseller (VAR), became a reseller to fill the market need for personal computers, and is emphasizing service and support to differentiate itself from price-oriented competitors.
We have one location--a 7,000 square foot store in a suburban shopping center located conveniently close to the downtown area. It includes a training area, service department, offices, and showroom area.
AMT is a privately-held C corporation owned in majority by its founder and president, Ralph Jones. There are six part owners, including four investors and two past employees. The firm includes 21 employees, under the president and four managers. Our main management divisions are sales, marketing, service, and administration. The service department handles service requests, support, training, and development. At present, we are weakest in the area of technical capabilities to manage the database marketing programs and upgraded service and support, particularly with cross-platform networks. We also need to find a training manager.
Recent changes in the computer reseller market have adversely affected AMT. These include margin squeezes, longer collection periods, and lower inventory turnovers. All of these concerns are part of the general trend affecting computer resellers. The margin squeeze is happening throughout the computer industry worldwide.
The only way we can hope to differentiate well is to define the vision of the company to be an information technology ally to our clients. We will not be able to compete in any effective way with the chains using boxes or products as appliances. We need to offer a real alliance that includes such intangibles as confidence, reliability, and knowing that somebody will be there to answer questions and help at the important times.
Our support services, with which we hope to capture market share will include such services as; training, upgrade offers, installation services, network configuration services, etc. The company will seek to aggressively pursue new opportunities.
AMT focuses on local markets, small business and home office, with special focus on the high-end home office and the 5-20 unit small business office.
The last study we saw published has retail sales growing at 5% per year, while Web sales and direct sales are growing at 25% or 30%.
There are several different kinds of computer retailers within the industry including:
- Computer dealers: often focused on a few main brands of hardware, usually offering only a minimum of software, and variable amounts of service and support. Their service and support is not usually very good and their prices are usually higher than the larger stores.
- Chain stores and computer superstores: usually offer decent walk-in service, with very aggressive pricing, and little support.
- Mail order: offer aggressive pricing of boxed product. For the purely price-driven buyer, who buys boxes and expects no service, these are very good options.
None of these direct competitors provides the customization and service that small businesses such as our clients truly need.
Small business buyers are accustomed to buying from vendors who visit their offices. They expect the copy machine vendors, office products vendors, and office furniture vendors, as well as the local graphic artists, freelance writers, or whomever, to visit their office to make their sales. Many small companies turn immediately to the superstores (office equipment, office supplies, and electronics) and mail order to look for the best price, without realizing that there is a better option for them at only a little bit more.
We need to effectively compete against the idea that businesses should buy computers as plug-in appliances that don't need ongoing service, support, and training. Our focus group sessions indicated that our target home office markets think about price but would buy based on quality service if the offering were properly presented. They think about price because that's all they ever see. We have very good indications that many would rather pay 10-20% more for a relationship with a long-term vendor providing back-up and quality service and support; they end up in the box-pusher channels because they aren't aware of the alternatives.
We currently depend on newspaper advertising as our main way to reach new buyers. As we change strategies, however, we need to change the way we promote ourselves. We will be refocusing on our core message of service through radio, cable TV, sales brochures, direct mailers and newspapers. We need to sell the company, not the product. We sell AMT, not Apple, IBM, Hewlett-Packard, or Compaq, or any of our software brand names.
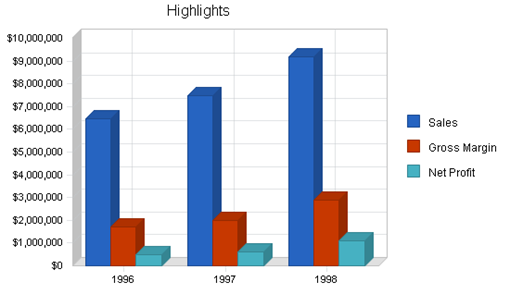
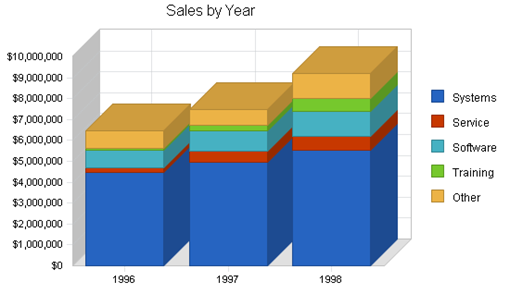
The Yearly Total Sales chart summarizes our ambitious sales forecast. We expect sales to increase from $5.3 million last year to more than $6 million next year and to more than $9 million in the last year of this plan.
1.1 Objectives
- Sales increasing to more than $9 million by the third year.
- Bring gross margin back up to above 30%, and maintain that level.
- Sell $1.5 million of service, support, and training by 1998.
- Improve inventory turnover to 6 turns by 1998.
1.2 Keys to Success
- Differentiate from box-pushing, price-oriented businesses by offering and delivering service and support -- and charging for it.
- Increase gross margin to more than 30%.
- Increase our non-hardware sales to 20% of the total sales by the third year.
1.3 Mission
AMT is built on the assumption that the management of information technology for business is like legal advice, accounting, graphic arts, and other bodies of knowledge, in that it is not inherently a do-it-yourself prospect. Smart business people who aren't computer hobbyists need to find quality vendors of reliable hardware, software, service, and support. They need to use these quality vendors as they use their other professional service suppliers, as trusted allies.
AMT is such a vendor. It serves its clients as a trusted ally, providing them with the loyalty of a business partner and the economics of an outside vendor. We make sure that our clients have what they need to run their businesses as well as possible, with maximum efficiency and reliability. Many of our information applications are mission critical, so we give our clients the assurance that we will be there when they need us.
Company Summary
AMT is a computer reseller based in the Uptown area. It was founded as a consulting-oriented VAR, became a reseller to fill the market need for personal computers, and is emphasizing service and support to differentiate itself from more price oriented national chains.
2.1 Company History
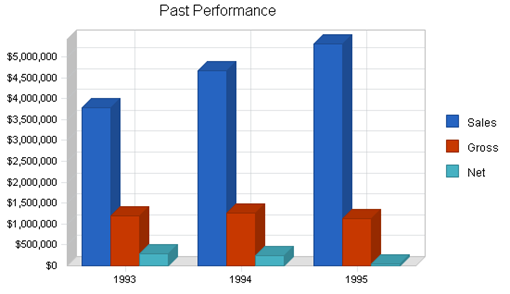
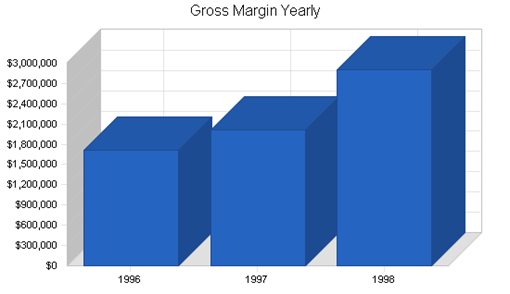
AMT has been caught in the vise grip of margin squeezes that have affected computer resellers worldwide. Although the chart titled Past Financial Performance shows that we have had healthy growth in sales, it also shows declining gross margin and declining profits.
The more detailed numbers in the Past Performance table include other indicators of some concern:
The gross margin % has been declining steadily, as we see in the chart.
Both collection days and inventory turnover are getting steadily worse.
All of these concerns are part of the general trend affecting computer resellers. The margin squeeze is happening throughout the computer industry worldwide.
|
Past Performance |
|||
|
1993 |
1994 |
1995 |
|
|
Sales |
$3,773,889 |
$4,661,902 |
$5,301,059 |
|
Gross Margin |
$1,189,495 |
$1,269,261 |
$1,127,568 |
|
Gross Margin % |
31.52% |
27.23% |
21.27% |
|
Operating Expenses |
$752,083 |
$902,500 |
$1,052,917 |
|
Collection Period (days) |
39 |
35 |
39 |
|
Inventory Turnover |
6.22 |
6.19 |
5.96 |
|
Balance Sheet |
|||
|
1993 |
1994 |
1995 |
|
|
Current Assets |
|||
|
Cash |
$43,023 |
$47,650 |
$55,432 |
|
Accounts Receivable |
$281,282 |
$347,468 |
$395,107 |
|
Inventory |
$573,159 |
$708,026 |
$805,098 |
|
Other Current Assets |
$15,000 |
$20,000 |
$25,000 |
|
Total Current Assets |
$912,464 |
$1,123,144 |
$1,280,637 |
|
Long-term Assets |
|||
|
Long-term Assets |
$250,000 |
$300,000 |
$350,000 |
|
Accumulated Depreciation |
$5,000 |
$20,000 |
$50,000 |
|
Total Long-term Assets |
$245,000 |
$280,000 |
$300,000 |
|
Total Assets |
$1,157,464 |
$1,403,144 |
$1,580,637 |
|
Current Liabilities |
|||
|
Accounts Payable |
$159,395 |
$196,901 |
$223,897 |
|
Current Borrowing |
$64,072 |
$79,149 |
$90,000 |
|
Other Current Liabilities (interest free) |
$10,679 |
$13,191 |
$15,000 |
|
Total Current Liabilities |
$234,146 |
$289,241 |
$328,897 |
|
Long-term Liabilities |
$202,797 |
$250,516 |
$284,862 |
|
Total Liabilities |
$436,943 |
$539,757 |
$613,759 |
|
Paid-in Capital |
$250,000 |
$350,000 |
$500,000 |
|
Retained Earnings |
$186,203 |
$274,992 |
$418,355 |
|
Earnings |
$284,318 |
$238,395 |
$48,523 |
|
Total Capital |
$720,521 |
$863,387 |
$966,878 |
|
Total Capital and Liabilities |
$1,157,464 |
$1,403,144 |
$1,580,637 |
|
Other Inputs |
|||
|
Payment Days |
30 |
30 |
30 |
|
Sales on Credit |
$2,641,722 |
$3,263,331 |
$3,445,688 |
|
Receivables Turnover |
9.39 |
9.39 |
8.72 |
2.2 Company Ownership
AMT is a privately-held C corporation owned in majority by its founder and president, Ralph Jones. There are six part owners, including four investors and two past employees. The largest of these (in percent of ownership) are Frank Dudley, our attorney, and Paul Karots, our public relations consultant. Neither owns more than 15%, but both are active participants in management decisions.
2.3 Company Locations and Facilities
We have one location--a 7,000 square foot store in a suburban shopping center located conveniently close to the downtown area. It includes a training area, service department, offices, and showroom area.
Products and Services
AMT provides both computer products and services to make them useful to small business. We are especially focused on providing network systems and services to small and medium business. The systems include both PC-based LAN systems and minicomputer server-based systems. Our services include design and installation of network systems, training, and support.
3.1 Product and Service Description
In personal computers, we support three main lines:
The Super Home is our smallest and least expensive line, initially positioned by its manufacturer as a home computer. We use it mainly as a cheap workstation for small business installations. Its specifications include ...[additional specifics omitted]
The Power User is our main up-scale line. It is our most important system for high-end home and small business main workstations, because of .... Its key strengths are .... Its specifications include ....[additional specifics omitted]
The Business Special is an intermediate system, used to fill the gap in the positioning. Its specifications include ... [additional specifics omitted]
In peripherals, accessories and other hardware, we carry a complete line of necessary items from cables to forms to mousepads ... [additional specifics omitted]
In service and support, we offer a range of walk-in or depot service, maintenance contracts and on-site guarantees. We have not had much success selling service contracts. Our networking capabilities ...[additional specifics omitted]
In software and training, we offer ... [additional specifics omitted]
3.2 Competitive Comparison
The only way we can hope to differentiate well is to define the vision of the company to be an information technology ally to our clients. We will not be able to compete in any effective way with the chains using boxes or products as appliances. We need to offer a real alliance.
The benefits we sell include many intangibles: confidence, reliability, knowing that somebody will be there to answer questions and help at the important times.
These are complex products, products that require serious knowledge and experience to use, and our competitors sell only the products themselves.
Unfortunately, we cannot sell the products at a higher price just because we offer services; the market has shown that it will not support that concept. We have to also sell the service and charge for it separately.
3.3 Sales Literature
Copies of our brochure and advertisements are attached as appendices. Of course, one of our first tasks will be to change the message of our literature to make sure we are selling the company, rather than the product.
3.4 Fulfillment
Our costs are part of the margin squeeze. As competition on price increases, the squeeze between manufacturers' price into channels and end-users' ultimate buying price continues.
With the hardware lines, our margins are declining steadily. We generally buy at ... Our margins are thus being squeezed from the 25% of five years ago to more like 13-15% at present. In the main-line peripherals a similar trend shows, with prices for printers and monitors declining steadily. We are also starting to see that same trend with software ....
In order to hold costs down as much as possible, we concentrate our purchasing with Hauser, which offers 30-day net terms and overnight shipping from the warehouse in Dayton. We need to concentrate on making sure our volume gives us negotiating strength.
In accessories and add-ons we can still get decent margins, 25% to 40%.
3.5 Technology
We have for years supported both Windows and Macintosh technology for CPUs, although we've switched vendors many times for the Windows (and previously DOS) lines. We are also supporting Novell, Banyon, and Microsoft networking, Xbase database software, and Claris application products.
3.6 Future Products and Services
We must remain on top of the new technologies, because this is our bread and butter. For networking, we need to provide better knowledge of cross platform technologies. Also, we are under pressure to improve our understanding of direct-connect internet and related communications. Finally, although we have a good command of desktop publishing, we are concerned about getting better at the integration of technologies that creates fax, copier, printer, and voice mail as part of the computer system.
3.7 Service and Support
Our strategy hinges on providing excellent service and support. This is critical. We need to differentiate on service and support, and to therefore deliver as well.
- Training: details would be essential in a real business plan, but not in this sample plan.
- Upgrade offers: details would be essential in a real business plan, but not in this sample plan.
- Our own internal training: details would be essential in a real business plan, but not in this sample plan.
- Installation services: details would be essential in a real business plan, but not in this sample plan.
- Custom software services: details would be essential in a real business plan, but not in this sample plan.
- Network configuration services: details would be essential in a real business plan, but not in this sample plan.
Market Analysis Summary
AMT focuses on local markets, small business and home office, with special focus on the high-end home office and the 5-20 unit small business office.
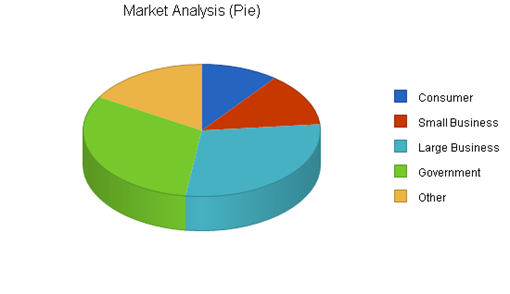
4.1 Market Segmentation
The segmentation allows some room for estimates and nonspecific definitions. We focus on a small-medium level of small business, and it is hard to find information to make an exact classification. Our target companies are large enough to need the high-quality information technology management we offer, but too small to have a separate computer management staff such as an MIS department. We say that our target market has 10-50 employees, and needs 5-20 workstations tied together in a local area network; the definition is flexible.
Defining the high-end home office is even more difficult. We generally know the characteristics of our target market, but we can't find easy classifications that fit into available demographics. The high-end home office business is a business, not a hobby. It generates enough money to merit the owner's paying real attention to the quality of information technology management, meaning that there is both budget and concerns that warrant working with our level of quality service and support. We can assume that we aren't talking about home offices used only part-time by people who work elsewhere during the day, and that our target market home office wants to have powerful technology and a lot of links between computing, telecommunications, and video.
|
Market Analysis |
|||||||
|
1996 |
1997 |
1998 |
1999 |
2000 |
|||
|
Potential Customers |
Growth |
CAGR |
|||||
|
Consumer |
2% |
12,000 |
12,240 |
12,485 |
12,735 |
12,990 |
2.00% |
|
Small Business |
5% |
15,000 |
15,750 |
16,538 |
17,365 |
18,233 |
5.00% |
|
Large Business |
8% |
33,000 |
35,640 |
38,491 |
41,570 |
44,896 |
8.00% |
|
Government |
-2% |
36,000 |
35,280 |
34,574 |
33,883 |
33,205 |
-2.00% |
|
Other |
0% |
19,000 |
19,000 |
19,000 |
19,000 |
19,000 |
0.00% |
|
Total |
2.78% |
115,000 |
117,910 |
121,088 |
124,553 |
128,324 |
2.78% |
4.2 Service Business Analysis
We are part of the computer reselling business, which includes several kinds of businesses:
- Computer dealers: storefront computer resellers, usually less than 5,000 square feet, often focused on a few main brands of hardware, usually offering only a minimum of software, and variable amounts of service and support. These are usually old-fashioned (1980s-style) computer stores and they usually offer relatively few reasons for buyers to shop with them. Their service and support is not usually very good and their prices are usually higher than the larger stores.
- Chain stores and computer superstores: these include major chains such as CompUSA, Computer City, Future Shop, etc. They are almost always more than 10,000 square feet of space, usually offer decent walk-in service, and are often warehouse-like locations where people go to find products in boxes with very aggressive pricing, and little support.
- Mail order: the market is served increasingly by mail order businesses that offer aggressive pricing of boxed product. For the purely price-driven buyer, who buys boxes and expects no service, these are very good options.
- Others: there are many other channels through which people buy their computers, usually variations of the main three types above.
4.2.1 Competition and Buying Patterns
The small business buyers understand the concept of service and support, and are much more likely to pay for it when the offering is clearly stated.
There is no doubt that we compete much more against all the box pushers than against other service providers. We need to effectively compete against the idea that businesses should buy computers as plug-in appliances that don't need ongoing service, support, and training.
Our focus group sessions indicated that our target Home Offices think about price but would buy based on quality service if the offering were properly presented. They think about price because that's all they ever see. We have very good indications that many would rather pay 10-20% more for a relationship with a long-term vendor providing back-up and quality service and support; they end up in the box-pusher channels because they aren't aware of the alternatives.
Availability is also very important. The Home Office buyers tend to want immediate, local solutions to problems.
4.2.2 Main Competitors
Chain stores:
We have Store 1 and Store 2 already within the valley, and Store 3 is expected
by the end of next year. If our strategy works, we will have differentiated
ourselves sufficiently to not have to compete against these stores.
Strengths: national image, high volume, aggressive pricing, economies of scale.
Weaknesses: lack of product, service and support knowledge, lack of personal attention.
Other local
computer stores:
Store 4 and Store 5 are both in the downtown area. They are both competing
against the chains in an attempt to match prices. When asked, the owners will
complain that margins are squeezed by the chains and customers buy on price
only. They say they tried offering services and that buyers didn't care,
instead preferring lower prices. We think the problem is also that they didn't
really offer good service, and also that they didn't differentiate from the
chains.
4.2.3 Business Participants
- The national chains are a growing presence. CompUSA, Computer City, Incredible Universe, Babbages, Egghead, and others. They benefit from national advertising, economies of scale, volume buying, and a general trend toward name-brand loyalty for buying in the channels as well as for products.
- Local computer stores are threatened. These tend to be small businesses, owned by people who started them because they liked computers. They are under-capitalized and under-managed. Margins are squeezed as they compete against the chains, in a competition based on price more than on service and support.
4.2.4 Distributing a Service
Small Business buyers are accustomed to buying from vendors who visit their offices. They expect the copy machine vendors, office products vendors, and office furniture vendors, as well as the local graphic artists, freelance writers, or whomever, to visit their office to make their sales.
There is usually a lot of leakage in ad-hoc purchasing through local chain stores and mail order. Often the administrators try to discourage this, but are only partially successful.
Unfortunately our Home Office target buyers may not expect to buy from us. Many of them turn immediately to the superstores (office equipment, office supplies, and electronics) and mail order to look for the best price, without realizing that there is a better option for them at only a little bit more.
4.3 Target Market Segment Strategy
We are part of the computer reselling business, which includes several kinds of businesses:
- Computer dealers: storefront computer resellers, usually less than 5,000 square feet, often focused on a few main brands of hardware, usually offering only a minimum of software, and variable amounts of service and support. These are usually old-fashioned (1980s-style) computer stores and they usually offer relatively few reasons for buyers to shop with them. Their service and support is not usually very good and their prices are usually higher than the larger stores.
- Chain stores and computer superstores: these include major chains such as CompUSA, Computer City, Future Shop, etc. They are almost always more than 10,000 square feet of space, usually offer decent walk-in service, and are often warehouse-like locations where people go to find products in boxes with very aggressive pricing, and little support.
- Mail order: the market is served increasingly by mail order businesses that offer aggressive pricing of boxed product. For the purely price-driven buyer, who buys boxes and expects no service, these are very good options.
- Others: there are many other channels through which people buy their computers, usually variations of the main three types above.
4.3.1 Market Needs
Since our target market is the service seeker, the most important market needs are support, service, training, and installation, in that order. One of the key points of our strategy is the focus on target segments that know and understand these needs and are willing to pay to have them filled.
All personal computer users need support and service. The self reliant ones, however, supply those needs themselves. In home offices, these are the knowledgeable computer users who like to do it themselves. Among the businesses, these are businesses that have people on staff.
4.3.2 Market Trends
The most obvious and important trend in the market is declining prices. This has been true for years, but the trend seems to be accelerating. We see the major brand-name manufacturers putting systems together with amazing specs--more power, more speed, more memory, more disk storage--at amazing prices. The major chain shops are selling brand-name powerful computers for less than $1,000.
This may be related to a second trend, which is the computer as throw-away appliance. By the time a system needs upgrading, it is cheaper to buy completely new. The increasing power and storage of a sub-$1000 system means buyers are asking for less service.
A third trend is ever greater connectivity. Everybody wants onto the internet, and every small office wants a LAN. A lot of small offices want their LAN connected to the internet.
4.3.3 Market Growth
As prices fall, unit sales increase. The published market research on sales of personal computers is astounding, as the United States market alone is absorbing more than 30 million units per year, and sales are growing at more than 20 percent per year. We could quote Dataquest, Infocorp, IDC, or others; it doesn't matter, they all agree on high growth of CPU sales.
Where growth is not as obvious is the retail market. A report in CRW says Dell is now selling $5 million monthly over the web, and we assume Gateway and Micron are both close to that. Direct mail has given way to the web, but catalogs are still powerful, and the non-retail sale is more accepted every day. The last study we saw published has retail sales growing at 5% per year, while web sales and direct sales are growing at 25% or 30%.
Strategy and Implementation Summary
The home offices in Tintown are an important growing market segment. Nationally, there are approximately 30 million home offices, and the number is growing at 10% per year. Our estimate in this plan for the home offices in our market service area is based on an analysis published four months ago in the local newspaper.
Home offices include several types. The most important, for our plan's focus, are the home offices that are the only offices of real businesses, from which people make their primary living. These are likely to be professional services such as graphic artists, writers, and consultants, some accountants and the occasional lawyer, doctor, or dentist. There are also part-time home offices with people who are employed during the day but work at home at night, people who work at home to provide themselves with a part-time income, or people who maintain home offices relating to their hobbies; we will not be focusing on this segment.
Small business within our market includes virtually any business with a retail, office, professional, or industrial location outside of someone's home, and fewer than 30 employees. We estimate 45,000 such businesses in our market area.
The 30-employee cutoff is arbitrary. We find that the larger companies turn to other vendors, but we can sell to departments of larger companies, and we shouldn't be giving up leads when we get them.
5.1 Strategy Pyramid
For placing emphasis on service and support, our main tactics are networking expertise, excellent training, and developing our own proprietary software/network administrative system. Our specific programs for networking include mailers and internal training. Specific programs for training include direct mail promotion, and train-the-trainers programs. For developing our own proprietary systems, our programs are company direct mail marketing, and working with VARs.
Our second strategy is emphasizing relationships. The tactics are marketing the company (instead of the products), more regular contacts with the customer, and increasing sales per customer. Programs for marketing the company include new sales literature, revised ad strategy, and direct mail. Programs for more regular contacts include call-backs after installation, direct mail, and sales management. Programs for increasing sales per customer include upgrade mailings and sales training.
5.2 Value Proposition
Our value proposition has to be different from the standard box-oriented retail chain. We offer our target customer, who is service seeking and not self reliant, a vendor who acts as a strategic ally, at a premium price that reflects the value of reassurance that systems will work.
5.3 Competitive Edge
Our competitive edge is our positioning as strategic ally with our clients, who are clients more than customers. By building a business based on long-standing relationships with satisfied clients, we simultaneously build defenses against competition. The longer the relationship stands, the more we help our clients understand what we offer them and why they need it.
5.4 Sales Strategy
- We need to sell the company, not the product. We sell AMT, not Apple, IBM, Hewlett-Packard, or Compaq, or any of our software brand names.
- We have to sell our service and support. The hardware is like the razor, and the support, service, software services, training, and seminars are the razor blades. We need to serve our customers with what they really need.
- The Yearly Total Sales chart summarizes our ambitious sales forecast. We expect sales to increase from $5.3 million last year to more than $6 million next year and to more than $9 million in the last year of this plan.
5.4.1 Sales Forecast
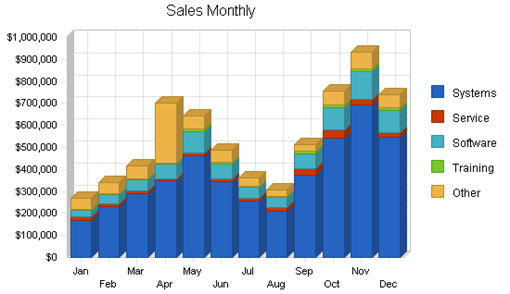
The important elements of the sales forecast are shown in the Total Sales by Month in Year 1 table. The non-hardware sales increase to over $2 million total in the third year.
|
Sales Forecast |
|||
|
1996 |
1997 |
1998 |
|
|
Unit Sales |
|||
|
Systems |
2,255 |
2,500 |
2,800 |
|
Service |
3,128 |
6,000 |
7,500 |
|
Software |
3,980 |
5,000 |
6,500 |
|
Training |
2,230 |
4,000 |
8,000 |
|
Other |
2,122 |
2,500 |
3,000 |
|
Total Unit Sales |
13,715 |
20,000 |
27,800 |
|
Unit Prices |
1996 |
1997 |
1998 |
|
Systems |
$1,980.80 |
$1,984.50 |
$1,980.80 |
|
Service |
$68.54 |
$84.00 |
$87.00 |
|
Software |
$212.87 |
$195.00 |
$180.00 |
|
Training |
$46.54 |
$72.00 |
$79.00 |
|
Other |
$394.21 |
$300.00 |
$394.00 |
|
Sales |
|||
|
Systems |
$4,466,711 |
$4,961,250 |
$5,546,240 |
|
Service |
$214,388 |
$504,000 |
$652,500 |
|
Software |
$847,220 |
$975,000 |
$1,170,000 |
|
Training |
$103,795 |
$288,000 |
$632,000 |
|
Other |
$836,520 |
$750,000 |
$1,182,000 |
|
Total Sales |
$6,468,634 |
$7,478,250 |
$9,182,740 |
|
Direct Unit Costs |
1996 |
1997 |
1998 |
|
Systems |
$1,700.00 |
$1,686.82 |
$1,683.68 |
|
Service |
$30.00 |
$30.00 |
$30.00 |
|
Software |
$120.00 |
$120.00 |
$120.00 |
|
Training |
$11.10 |
$11.10 |
$11.10 |
|
Other |
$90.00 |
$90.00 |
$90.00 |
|
Direct Cost of Sales |
|||
|
Systems |
$3,833,500 |
$4,217,050 |
$4,714,304 |
|
Service |
$93,840 |
$180,000 |
$225,000 |
|
Software |
$477,600 |
$600,000 |
$780,000 |
|
Training |
$24,753 |
$44,400 |
$88,800 |
|
Other |
$190,980 |
$225,000 |
$270,000 |
|
Subtotal Direct Cost of Sales |
$4,620,673 |
$5,266,450 |
$6,078,104 |
5.4.2 Sales Programs
- Direct mail: Use great detail to describe your company's programs here.
- Seminars: Use great detail to describe your company's programs here.
5.4.3 Distribution Strategy
Our most important marketing program is [specifics omitted]. Leslie Doe will be responsible, with budget of $XX,XXX and milestone date of the 15th of May. This program is intended to [objectives omitted]. Achievement should be measured by [specific concrete measurement].
Another key marketing program is [specifics omitted]. [Name] will be responsible, with budget of $XX,XXX and milestone date of [date]. This program is intended to [objectives omitted]. Achievement should be measured by [specific concrete measurement].
5.5 Marketing Strategy
The marketing strategy is the core of the main strategy:
- Emphasize service and support.
- Build a relationship business.
- Focus on small business and high-end home office as key target markets.
5.5.1 Promotion Strategy
We depend on newspaper advertising as our main way to reach new buyers. As we change strategies, however, we need to change the way we promote ourselves:
Advertising
We'll be developing our core positioning message: "24 Hour On-Site Service
- 365 Days a Year With No Extra Charges" to differentiate our service from
the competition. We will be using local newspaper advertising, radio, and cable
TV to launch the initial campaign.
Sales Brochure
Our collaterals have to sell the store, and visiting the store, not the
specific book or discount pricing.
Direct Mail
We must radically improve our direct mail efforts, reaching our established
customers with training, support services, upgrades, and seminars.
Local Media
It's time to work more closely with the local media. We could offer the local
radio a regular talk show on technology for small business, as one example.
5.5.2 Pricing Strategy
We must charge appropriately for the high-end, high-quality service and support we offer. Our revenue structure has to match our cost structure, so the salaries we pay to assure good service and support must be balanced by the revenue we charge.
We cannot build the service and support revenue into the price of products. The market can't bear the higher prices and the buyer feels ill-used when they see the same product priced lower at the chains. Despite the logic behind this, the market doesn't support this concept.
Therefore, we must make sure that we deliver and charge for service and support. Training, service, installation, networking support--all of this must be readily available and priced to sell and deliver revenue.
5.5.3 Positioning Statement
For businesspeople who want to be sure their computer systems are always working reliably, AMT is a vendor and trusted strategic ally who makes sure their systems work, their people are trained, and their down time is minimal. Unlike the chain retail stores, it knows the customer and goes to his or her site when needed, and offers proactive support, service, training, and installation.
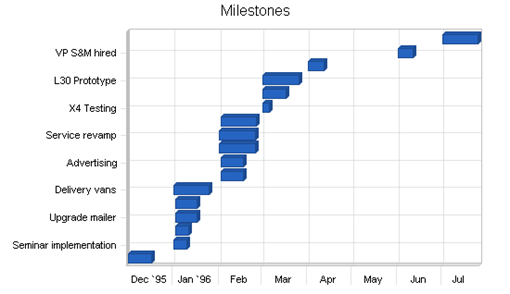
5.6 Milestones
Our important milestones are shown on the following table. Row by row, they track the need to follow up on strategy with specific activities. Most of the activities on the list can be easily tied to our strategic goals of selling more service and enhancing the relationship with the customer.
|
Milestones |
|||||
|
Milestone |
Start Date |
End Date |
Budget |
Manager |
Department |
|
Corporate Identity |
12/1/1995 |
12/17/1995 |
$10,000 |
TJ |
Marketing |
|
Seminar implementation |
1/1/1996 |
1/10/1996 |
$1,000 |
IR |
Sales |
|
Business Plan Review |
1/2/1996 |
1/11/1996 |
$0 |
RJ |
GM |
|
Upgrade mailer |
1/2/1996 |
1/17/1996 |
$5,000 |
IR |
Sales |
|
New corporate brochure |
1/2/1996 |
1/17/1996 |
$5,000 |
TJ |
Marketing |
|
Delivery vans |
1/1/1996 |
1/25/1996 |
$12,500 |
SD |
Service |
|
Direct mail |
2/2/1996 |
2/17/1996 |
$3,500 |
IR |
Marketing |
|
Advertising |
2/2/1996 |
2/17/1996 |
$115,000 |
RJ |
GM |
|
X4 Prototype |
2/1/1996 |
2/25/1996 |
$2,500 |
SG |
Product |
|
Service revamp |
2/1/1996 |
2/25/1996 |
$2,500 |
SD |
Product |
|
6 presentations |
2/2/1996 |
2/26/1996 |
$0 |
IR |
Sales |
|
X4 Testing |
3/1/1996 |
3/6/1996 |
$1,000 |
SG |
Product |
|
3 Accounts |
3/1/1996 |
3/17/1996 |
$0 |
SD |
Sales |
|
L30 Prototype |
3/1/1996 |
3/26/1996 |
$2,500 |
PR |
Product |
|
Tech95 Expo |
4/1/1996 |
4/12/1996 |
$15,000 |
TB |
Marketing |
|
VP S&M hired |
6/1/1996 |
6/11/1996 |
$1,000 |
JK |
Sales |
|
Mailing System |
7/1/1996 |
7/25/1996 |
$5,000 |
SD |
Service |
|
Totals |
$181,500 |
||||
Management Summary
Our management philosophy is based on responsibility and mutual respect. People who work at AMT want to work at AMT because we have an environment that encourages creativity and achievement.
6.1 Organizational Structure
- The team includes 21 employees, under a president and four managers.
- Our main management divisions are sales, marketing, service, and administration. Service handles service, support, training, and development.
6.2 Management Team
Ralph Jones, President: 46 years old, founded AMT in 1984 to focus on reselling high-powered personal computers to small business. Degree in computer science, 15 years with Large Computer Company, Inc. in positions ending with project manager. Ralph has been attending courses at the local Small Business Development Center for more than six years now, steadily adding business skills and business training to his technical background.
Sabrina Benson, VP Marketing: 36 years old, joined us last year following a very successful career with Continental Computers. Her hiring was the culmination of a long recruiting search. With Continental she managed the VAR marketing division. She is committed to re-engineering AMT to be a service and support business that sells computers, not vice-versa. MBA, undergraduate degree in history.
Gary Andrews, VP Service and Support: 48 years old, 18 years with Large Computers, Inc. in programming and service-related positions, 7 years with AMT. MS in computer science and BS in electrical engineering.
Laura Dannis, VP Sales: 32, former teacher, joined AMT part-time in 1991 and went full-time in 1992. Very high people skills, BA in elementary education. She has taken several sales management courses at the local SBDC.
John Peters, Director of Administration: 43, started with AMT as a part-time bookkeeper in 1987, and has become full-time administrative and financial backbone of the company.
6.3 Management Team Gaps
At present we believe we have a good team for covering the main points of the business plan. The addition of Sabrina Benson was important as a way to cement our fundamental re-positioning and re-engineering.
At present, we are weakest in the area of technical capabilities to manage the database marketing programs and upgraded service and support, particularly with cross-platform networks. We also need to find a training manager.
6.4 Personnel Plan
The Personnel Plan reflects the need to bolster our capabilities to match our positioning. Our total headcount should increase to 26 this first year, and to 31 by the third year. Detailed monthly projections are included in the appendix.
|
Personnel Plan |
|||
|
1996 |
1997 |
1998 |
|
|
Production Personnel |
|||
|
Manager |
$36,000 |
$40,000 |
$40,000 |
|
Assistant |
$12,000 |
$13,000 |
$14,000 |
|
Technical |
$12,500 |
$35,000 |
$35,000 |
|
Technical |
$12,500 |
$35,000 |
$35,000 |
|
Technical |
$24,000 |
$27,500 |
$27,500 |
|
Fulfillment |
$24,000 |
$30,000 |
$30,000 |
|
Fulfillment |
$18,000 |
$22,000 |
$22,000 |
|
Subtotal |
$139,000 |
$202,500 |
$203,500 |
|
Sales and Marketing Personnel |
|||
|
Manager |
$72,000 |
$76,000 |
$80,000 |
|
Technical Sales |
$60,000 |
$63,000 |
$85,000 |
|
Technical Sales |
$45,500 |
$46,000 |
$46,000 |
|
Salesperson |
$40,500 |
$55,000 |
$64,000 |
|
Salesperson |
$40,500 |
$50,000 |
$55,000 |
|
Salesperson |
$33,500 |
$34,000 |
$45,000 |
|
Salesperson |
$31,000 |
$38,000 |
$45,000 |
|
Salesperson |
$21,000 |
$30,000 |
$33,000 |
|
Salesperson |
$0 |
$30,000 |
$33,000 |
|
Subtotal |
$344,000 |
$422,000 |
$486,000 |
|
General and Administrative Personnel |
|||
|
President |
$66,000 |
$69,000 |
$95,000 |
|
Finance |
$28,000 |
$29,000 |
$30,000 |
|
Admin Assistant |
$24,000 |
$26,000 |
$28,000 |
|
Bookkeeping |
$18,000 |
$25,000 |
$30,000 |
|
Clerical |
$12,000 |
$15,000 |
$18,000 |
|
Clerical |
$7,000 |
$15,000 |
$18,000 |
|
Clerical |
$0 |
$0 |
$15,000 |
|
Subtotal |
$155,000 |
$179,000 |
$234,000 |
|
Other Personnel |
|||
|
Programming |
$36,000 |
$40,000 |
$44,000 |
|
Other Technical |
$0 |
$30,000 |
$33,000 |
|
Subtotal |
$36,000 |
$70,000 |
$77,000 |
|
Total People |
26 |
27 |
31 |
|
Total Payroll |
$674,000 |
$873,500 |
$1,000,500 |
6.5 Other Management Considerations
Our attorney, Frank Dudley, is also a co-founder. He invested significantly in the company over a period of time during the 1980's. He remains a good friend of Ralph and has been a steady source of excellent legal and business advice.
Paul Karots, public relations consultant, is also a co-founder and co-owner. Like Dudley, he invested in the early stages and remains a trusted confidant and vendor of public relations and advertising services.
Financial Plan
The most important element in the financial plan is the critical need for improving several of the key factors that impact cash flow:
- We must at any cost stop the slide in inventory turnover and develop better inventory management to bring the turnover back up to 6 turns by the third year. This should also be a function of the shift in focus towards service revenues to add to the hardware revenues.
- We must also bring the gross margin back up to 30%. This too is related to improving the mix between hardware and service revenues, because the service revenues offer much better margins.
- We plan to borrow another $100,000 long-term this year. The amount seems in line with the balance sheet capabilities.
7.1 Important Assumptions
The financial plan depends on important assumptions, most of which are shown in Table 7.1. The key underlying assumptions are:
- We assume a slow-growth economy, without major recession.
- We assume of course that there are no unforeseen changes in technology to make products immediately obsolete.
|
General Assumptions |
|||
|
1996 |
1997 |
1998 |
|
|
Plan Month |
1 |
2 |
3 |
|
Current Interest Rate |
8.00% |
8.00% |
8.00% |
|
Long-term Interest Rate |
8.50% |
8.50% |
8.50% |
|
Tax Rate |
20.18% |
20.18% |
20.18% |
|
Other |
0 |
0 |
0 |
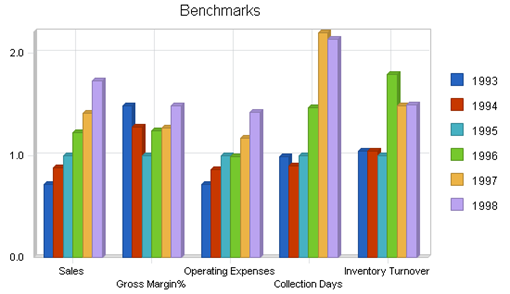
7.2 Key Financial Indicators
The Benchmark Comparison chart highlights our ambitious plans to correct declining gross margin and inventory turnover. The chart illustrates why we think the ambitious sales increases we plan are reasonable. We have had similar increases in the recent past.
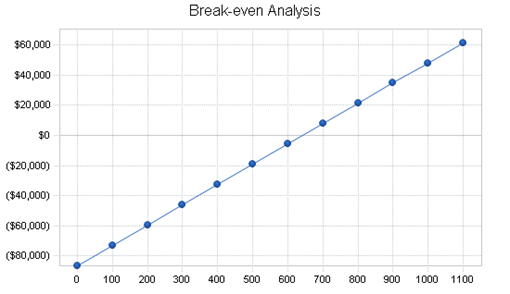
7.3 Break-even Analysis
For our break-even analysis, we assume running costs which include our full payroll, rent, and utilities, and an estimation of other running costs. Payroll alone, at our present run rate, is only about $55,000. Margins are harder to assume. Our overall average is based on projections for the coming year. We hope to attain a margin that high in the future.
The chart shows how much we need to sell per month to break even, according to these assumptions.
|
Break-even Analysis |
|
|
Monthly Units Break-even |
642 |
|
Monthly Revenue Break-even |
$302,979 |
|
Assumptions: |
|
|
Average Per-Unit Revenue |
$471.65 |
|
Average Per-Unit Variable Cost |
$336.91 |
|
Estimated Monthly Fixed Cost |
$86,555 |
7.4 Projected Profit and Loss
The most important assumption in the Projected Profit and Loss statement is the gross margin, which is supposed to increase. This is up from barely 21% in the last year. The increase in gross margin is based on changing our sales mix, and it is critical. Month-by-month assumptions for profit and loss are included in the appendix.
|
Pro Forma Profit and Loss |
|||
|
1996 |
1997 |
1998 |
|
|
Sales |
$6,468,634 |
$7,478,250 |
$9,182,740 |
|
Direct Cost of Sales |
$4,620,673 |
$5,266,450 |
$6,078,104 |
|
Production Payroll |
$139,000 |
$202,500 |
$203,500 |
|
Other Costs of Sales |
$0 |
$0 |
$0 |
|
Total Cost of Sales |
$4,759,673 |
$5,468,950 |
$6,281,604 |
|
Gross Margin |
$1,708,961 |
$2,009,300 |
$2,901,136 |
|
Gross Margin % |
26.42% |
26.87% |
31.59% |
|
Operating Expenses |
|||
|
Sales and Marketing Expenses |
|||
|
Sales and Marketing Payroll |
$344,000 |
$422,000 |
$486,000 |
|
Ads |
$125,000 |
$140,000 |
$175,000 |
|
Catalog |
$25,000 |
$19,039 |
$19,991 |
|
Mailing |
$113,300 |
$120,000 |
$150,000 |
|
Promo |
$16,000 |
$20,000 |
$25,000 |
|
Shows |
$20,200 |
$25,000 |
$30,000 |
|
Literature |
$7,000 |
$10,000 |
$12,500 |
|
PR |
$1,000 |
$1,250 |
$1,500 |
|
Seminar |
$31,000 |
$45,000 |
$60,000 |
|
Service |
$10,250 |
$12,000 |
$15,000 |
|
Training |
$5,400 |
$7,000 |
$15,000 |
|
Total Sales and Marketing Expenses |
$698,150 |
$821,289 |
$989,991 |
|
Sales and Marketing % |
10.79% |
10.98% |
10.78% |
|
General and Administrative Expenses |
|||
|
General and Administrative Payroll |
$155,000 |
$179,000 |
$234,000 |
|
Marketing/Promotion |
$0 |
$0 |
$0 |
|
Depreciation |
$12,681 |
$13,315 |
$13,981 |
|
Leased Equipment |
$30,000 |
$31,500 |
$33,075 |
|
Rent |
$84,000 |
$88,200 |
$92,610 |
|
Utilities |
$9,000 |
$9,450 |
$9,923 |
|
Insurance |
$6,000 |
$6,300 |
$6,615 |
|
Payroll Taxes |
$0 |
$0 |
$0 |
|
Other General and Administrative Expenses |
$6,331 |
$6,648 |
$6,980 |
|
Total General and Administrative Expenses |
$303,012 |
$334,413 |
$397,184 |
|
General and Administrative % |
4.68% |
4.47% |
4.33% |
|
Other Expenses: |
|||
|
Other Payroll |
$36,000 |
$70,000 |
$77,000 |
|
Contract/Consultants |
$1,500 |
$5,000 |
$30,000 |
|
Other Expenses |
$0 |
$0 |
$0 |
|
Total Other Expenses |
$37,500 |
$75,000 |
$107,000 |
|
Other % |
0.58% |
1.00% |
1.17% |
|
Total Operating Expenses |
$1,038,662 |
$1,230,702 |
$1,494,175 |
|
Profit Before Interest and Taxes |
$670,299 |
$778,598 |
$1,406,961 |
|
EBITDA |
$682,980 |
$791,913 |
$1,420,942 |
|
Interest Expense |
$35,568 |
$31,710 |
$25,557 |
|
Taxes Incurred |
$128,111 |
$150,748 |
$278,816 |
|
Net Profit |
$506,619 |
$596,140 |
$1,102,588 |
|
Net Profit/Sales |
7.83% |
7.97% |
12.01% |
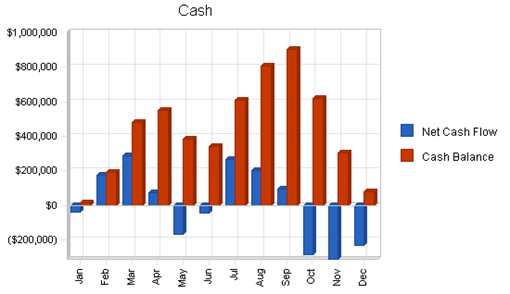
7.5 Projected Cash Flow
The cash flow depends on assumptions for inventory turnover, payment days, and accounts receivable management. Our projected 60-day collection days is not ideal, but it is realistic in this market, and hard for us to effectively change. We're better off planning for it than ignoring it. We need significant new financing in March to get through a cash flow dip as we build up for mid-year sales.
|
Pro Forma Cash Flow |
|||
|
1996 |
1997 |
1998 |
|
|
Cash Received |
|||
|
Cash from Operations |
|||
|
Cash Sales |
$970,295 |
$1,121,738 |
$1,377,411 |
|
Cash from Receivables |
$4,496,795 |
$6,138,525 |
$7,437,311 |
|
Subtotal Cash from Operations |
$5,467,090 |
$7,260,263 |
$8,814,722 |
|
Additional Cash Received |
|||
|
Sales Tax, VAT, HST/GST Received |
$0 |
$0 |
$0 |
|
New Current Borrowing |
$0 |
$0 |
$0 |
|
New Other Liabilities (interest-free) |
$0 |
$0 |
$0 |
|
New Long-term Liabilities |
$100,000 |
$0 |
$0 |
|
Sales of Other Current Assets |
$0 |
$0 |
$0 |
|
Sales of Long-term Assets |
$0 |
$0 |
$0 |
|
New Investment Received |
$0 |
$0 |
$0 |
|
Subtotal Cash Received |
$5,567,090 |
$7,260,263 |
$8,814,722 |
|
Expenditures |
1996 |
1997 |
1998 |
|
Expenditures from Operations |
|||
|
Cash Spending |
$674,000 |
$873,500 |
$1,000,500 |
|
Bill Payments |
$4,807,920 |
$6,016,976 |
$7,073,860 |
|
Subtotal Spent on Operations |
$5,481,920 |
$6,890,476 |
$8,074,360 |
|
Additional Cash Spent |
|||
|
Sales Tax, VAT, HST/GST Paid Out |
$0 |
$0 |
$0 |
|
Principal Repayment of Current Borrowing |
$26,000 |
$32,000 |
$32,000 |
|
Other Liabilities Principal Repayment |
$0 |
$0 |
$0 |
|
Long-term Liabilities Principal Repayment |
$36,709 |
$40,543 |
$43,989 |
|
Purchase Other Current Assets |
$0 |
$0 |
$0 |
|
Purchase Long-term Assets |
$0 |
$0 |
$0 |
|
Dividends |
$0 |
$0 |
$0 |
|
Subtotal Cash Spent |
$5,544,629 |
$6,963,019 |
$8,150,349 |
|
Net Cash Flow |
$22,461 |
$297,244 |
$664,373 |
|
Cash Balance |
$77,893 |
$375,137 |
$1,039,509 |
7.6 Projected Balance Sheet
The Projected Balance Sheet is quite solid. We do not project any real trouble meeting our debt obligations--as long as we can achieve our specific objectives.
|
Pro Forma Balance Sheet |
|||
|
1996 |
1997 |
1998 |
|
|
Assets |
|||
|
Current Assets |
|||
|
Cash |
$77,893 |
$375,137 |
$1,039,509 |
|
Accounts Receivable |
$1,396,650 |
$1,614,638 |
$1,982,656 |
|
Inventory |
$556,810 |
$634,629 |
$732,436 |
|
Other Current Assets |
$25,000 |
$25,000 |
$25,000 |
|
Total Current Assets |
$2,056,353 |
$2,649,403 |
$3,779,602 |
|
Long-term Assets |
|||
|
Long-term Assets |
$350,000 |
$350,000 |
$350,000 |
|
Accumulated Depreciation |
$62,681 |
$75,996 |
$89,977 |
|
Total Long-term Assets |
$287,319 |
$274,004 |
$260,023 |
|
Total Assets |
$2,343,672 |
$2,923,407 |
$4,039,625 |
|
Liabilities and Capital |
1996 |
1997 |
1998 |
|
Current Liabilities |
|||
|
Accounts Payable |
$443,022 |
$499,160 |
$588,779 |
|
Current Borrowing |
$64,000 |
$32,000 |
$0 |
|
Other Current Liabilities |
$15,000 |
$15,000 |
$15,000 |
|
Subtotal Current Liabilities |
$522,022 |
$546,160 |
$603,779 |
|
Long-term Liabilities |
$348,153 |
$307,610 |
$263,621 |
|
Total Liabilities |
$870,175 |
$853,770 |
$867,400 |
|
Paid-in Capital |
$500,000 |
$500,000 |
$500,000 |
|
Retained Earnings |
$466,878 |
$973,497 |
$1,569,637 |
|
Earnings |
$506,619 |
$596,140 |
$1,102,588 |
|
Total Capital |
$1,473,497 |
$2,069,637 |
$3,172,225 |
|
Total Liabilities and Capital |
$2,343,672 |
$2,923,407 |
$4,039,625 |
|
Net Worth |
$1,473,497 |
$2,069,637 |
$3,172,225 |
7.7 Business Ratios
The table follows with our main business ratios. We do intend to improve gross margin, collection days, and inventory turnover. The industry standards are taken for industry classification 5734 in the SIC code. We assume that the difference between our results and the standards is that the standards include
|
Ratio Analysis |
||||
|
1996 |
1997 |
1998 |
Industry Profile |
|
|
Sales Growth |
22.03% |
15.61% |
22.79% |
10.50% |
|
Percent of Total Assets |
||||
|
Accounts Receivable |
59.59% |
55.23% |
49.08% |
19.20% |
|
Inventory |
23.76% |
21.71% |
18.13% |
38.00% |
|
Other Current Assets |
1.07% |
0.86% |
0.62% |
20.80% |
|
Total Current Assets |
87.74% |
90.63% |
93.56% |
78.00% |
|
Long-term Assets |
12.26% |
9.37% |
6.44% |
22.00% |
|
Total Assets |
100.00% |
100.00% |
100.00% |
100.00% |
|
Current Liabilities |
22.27% |
18.68% |
14.95% |
44.60% |
|
Long-term Liabilities |
14.86% |
10.52% |
6.53% |
14.10% |
|
Total Liabilities |
37.13% |
29.20% |
21.47% |
58.70% |
|
Net Worth |
62.87% |
70.80% |
78.53% |
41.30% |
|
Percent of Sales |
||||
|
Sales |
100.00% |
100.00% |
100.00% |
100.00% |
|
Gross Margin |
26.42% |
26.87% |
31.59% |
37.20% |
|
Selling, General & Administrative Expenses |
18.59% |
18.90% |
19.59% |
22.30% |
|
Advertising Expenses |
1.93% |
1.87% |
1.91% |
4.10% |
|
Profit Before Interest and Taxes |
10.36% |
10.41% |
15.32% |
1.50% |
|
Main Ratios |
||||
|
Current |
3.94 |
4.85 |
6.26 |
1.78 |
|
Quick |
2.87 |
3.69 |
5.05 |
0.75 |
|
Total Debt to Total Assets |
37.13% |
29.20% |
21.47% |
58.70% |
|
Pre-tax Return on Net Worth |
43.08% |
36.09% |
43.55% |
3.80% |
|
Pre-tax Return on Assets |
27.08% |
25.55% |
34.20% |
9.30% |
|
Additional Ratios |
1996 |
1997 |
1998 |
|
|
Net Profit Margin |
7.83% |
7.97% |
12.01% |
n.a |
|
Return on Equity |
34.38% |
28.80% |
34.76% |
n.a |
|
Activity Ratios |
||||
|
Accounts Receivable Turnover |
3.94 |
3.94 |
3.94 |
n.a |
|
Collection Days |
58 |
86 |
84 |
n.a |
|
Inventory Turnover |
10.68 |
8.84 |
8.89 |
n.a |
|
Accounts Payable Turnover |
11.35 |
12.17 |
12.17 |
n.a |
|
Payment Days |
28 |
28 |
28 |
n.a |
|
Total Asset Turnover |
2.76 |
2.56 |
2.27 |
n.a |
|
Debt Ratios |
||||
|
Debt to Net Worth |
0.59 |
0.41 |
0.27 |
n.a |
|
Current Liab. to Liab. |
0.60 |
0.64 |
0.70 |
n.a |
|
Liquidity Ratios |
||||
|
Net Working Capital |
$1,534,331 |
$2,103,243 |
$3,175,823 |
n.a |
|
Interest Coverage |
18.85 |
24.55 |
55.05 |
n.a |
|
Additional Ratios |
||||
|
Assets to Sales |
0.36 |
0.39 |
0.44 |
n.a |
|
Current Debt/Total Assets |
22% |
19% |
15% |
n.a |
|
Acid Test |
0.20 |
0.73 |
1.76 |
n.a |
|
Sales/Net Worth |
4.39 |
3.61 |
2.89 |
n.a |
|
Dividend Payout |
0.00 |
0.00 |
0.00 |
n.a |
Appendix
|
Sales Forecast |
|||||||||||||
|
Jan |
Feb |
Mar |
Apr |
May |
Jun |
Jul |
Aug |
Sep |
Oct |
Nov |
Dec |
||
|
Unit Sales |
|||||||||||||
|
Systems |
0% |
85 |
115 |
145 |
190 |
245 |
175 |
120 |
100 |
180 |
275 |
350 |
275 |
|
Service |
0% |
200 |
200 |
200 |
200 |
244 |
256 |
269 |
282 |
296 |
311 |
327 |
343 |
|
Software |
0% |
150 |
200 |
250 |
330 |
430 |
310 |
210 |
180 |
320 |
490 |
620 |
490 |
|
Training |
0% |
145 |
155 |
165 |
170 |
225 |
200 |
150 |
150 |
200 |
220 |
250 |
200 |
|
Other |
0% |
160 |
176 |
192 |
240 |
200 |
175 |
125 |
100 |
104 |
200 |
250 |
200 |
|
Total Unit Sales |
740 |
846 |
952 |
1,130 |
1,344 |
1,116 |
874 |
812 |
1,100 |
1,496 |
1,797 |
1,508 |
|
|
Unit Prices |
Jan |
Feb |
Mar |
Apr |
May |
Jun |
Jul |
Aug |
Sep |
Oct |
Nov |
Dec |
|
|
Systems |
$2,000.00 |
$2,000.00 |
$2,000.00 |
$1,828.95 |
$1,890.63 |
$1,966.17 |
$2,131.58 |
$2,115.38 |
$2,083.33 |
$1,966.40 |
$1,980.29 |
$1,984.50 |
|
|
Service |
$75.00 |
$69.00 |
$58.00 |
$46.00 |
$50.00 |
$47.00 |
$50.00 |
$50.00 |
$91.00 |
$124.00 |
$75.00 |
$67.00 |
|
|
Software |
$200.00 |
$200.00 |
$200.00 |
$200.00 |
$223.00 |
$217.00 |
$242.00 |
$253.00 |
$220.00 |
$211.00 |
$204.00 |
$207.00 |
|
|
Training |
$37.00 |
$35.00 |
$39.00 |
$41.00 |
$56.00 |
$50.00 |
$33.00 |
$33.00 |
$50.00 |
$55.00 |
$60.00 |
$50.00 |
|
|
Other |
$300.00 |
$300.00 |
$300.00 |
$1,133.00 |
$300.00 |
$300.00 |
$300.00 |
$300.00 |
$300.00 |
$300.00 |
$300.00 |
$300.00 |
|
|
Sales |
|||||||||||||
|
Systems |
$170,000 |
$230,000 |
$290,000 |
$347,501 |
$463,204 |
$344,080 |
$255,790 |
$211,538 |
$374,999 |
$540,760 |
$693,102 |
$545,738 |
|
|
Service |
$15,000 |
$13,800 |
$11,600 |
$9,200 |
$12,200 |
$12,032 |
$13,450 |
$14,100 |
$26,936 |
$38,564 |
$24,525 |
$22,981 |
|
|
Software |
$30,000 |
$40,000 |
$50,000 |
$66,000 |
$95,890 |
$67,270 |
$50,820 |
$45,540 |
$70,400 |
$103,390 |
$126,480 |
$101,430 |
|
|
Training |
$5,365 |
$5,425 |
$6,435 |
$6,970 |
$12,600 |
$10,000 |
$4,950 |
$4,950 |
$10,000 |
$12,100 |
$15,000 |
$10,000 |
|
|
Other |
$48,000 |
$52,800 |
$57,600 |
$271,920 |
$60,000 |
$52,500 |
$37,500 |
$30,000 |
$31,200 |
$60,000 |
$75,000 |
$60,000 |
|
|
Total Sales |
$268,365 |
$342,025 |
$415,635 |
$701,591 |
$643,894 |
$485,882 |
$362,510 |
$306,128 |
$513,535 |
$754,814 |
$934,107 |
$740,149 |
|
|
Direct Unit Costs |
Jan |
Feb |
Mar |
Apr |
May |
Jun |
Jul |
Aug |
Sep |
Oct |
Nov |
Dec |
|
|
Systems |
0.00% |
$1,700.00 |
$1,700.00 |
$1,700.00 |
$1,700.00 |
$1,700.00 |
$1,700.00 |
$1,700.00 |
$1,700.00 |
$1,700.00 |
$1,700.00 |
$1,700.00 |
$1,700.00 |
|
Service |
0.00% |
$30.00 |
$30.00 |
$30.00 |
$30.00 |
$30.00 |
$30.00 |
$30.00 |
$30.00 |
$30.00 |
$30.00 |
$30.00 |
$30.00 |
|
Software |
0.00% |
$120.00 |
$120.00 |
$120.00 |
$120.00 |
$120.00 |
$120.00 |
$120.00 |
$120.00 |
$120.00 |
$120.00 |
$120.00 |
$120.00 |
|
Training |
0.00% |
$11.10 |
$11.10 |
$11.10 |
$11.10 |
$11.10 |
$11.10 |
$11.10 |
$11.10 |
$11.10 |
$11.10 |
$11.10 |
$11.10 |
|
Other |
0.00% |
$90.00 |
$90.00 |
$90.00 |
$90.00 |
$90.00 |
$90.00 |
$90.00 |
$90.00 |
$90.00 |
$90.00 |
$90.00 |
$90.00 |
|
Direct Cost of Sales |
|||||||||||||
|
Systems |
$144,500 |
$195,500 |
$246,500 |
$323,000 |
$416,500 |
$297,500 |
$204,000 |
$170,000 |
$306,000 |
$467,500 |
$595,000 |
$467,500 |
|
|
Service |
$6,000 |
$6,000 |
$6,000 |
$6,000 |
$7,320 |
$7,680 |
$8,070 |
$8,460 |
$8,880 |
$9,330 |
$9,810 |
$10,290 |
|
|
Software |
$18,000 |
$24,000 |
$30,000 |
$39,600 |
$51,600 |
$37,200 |
$25,200 |
$21,600 |
$38,400 |
$58,800 |
$74,400 |
$58,800 |
|
|
Training |
$1,610 |
$1,721 |
$1,832 |
$1,887 |
$2,498 |
$2,220 |
$1,665 |
$1,665 |
$2,220 |
$2,442 |
$2,775 |
$2,220 |
|
|
Other |
$14,400 |
$15,840 |
$17,280 |
$21,600 |
$18,000 |
$15,750 |
$11,250 |
$9,000 |
$9,360 |
$18,000 |
$22,500 |
$18,000 |
|
|
Subtotal Direct Cost of Sales |
$184,510 |
$243,061 |
$301,612 |
$392,087 |
$495,918 |
$360,350 |
$250,185 |
$210,725 |
$364,860 |
$556,072 |
$704,485 |
$556,810 |
|
|
Personnel Plan |
|||||||||||||
|
Jan |
Feb |
Mar |
Apr |
May |
Jun |
Jul |
Aug |
Sep |
Oct |
Nov |
Dec |
||
|
Production Personnel |
|||||||||||||
|
Manager |
$3,000 |
$3,000 |
$3,000 |
$3,000 |
$3,000 |
$3,000 |
$3,000 |
$3,000 |
$3,000 |
$3,000 |
$3,000 |
$3,000 |
|
|
Assistant |
$1,000 |
$1,000 |
$1,000 |
$1,000 |
$1,000 |
$1,000 |
$1,000 |
$1,000 |
$1,000 |
$1,000 |
$1,000 |
$1,000 |
|
|
Technical |
$0 |
$0 |
$0 |
$0 |
$0 |
$0 |
$0 |
$2,500 |
$2,500 |
$2,500 |
$2,500 |
$2,500 |
|
|
Technical |
$0 |
$0 |
$0 |
$0 |
$0 |
$0 |
$0 |
$2,500 |
$2,500 |
$2,500 |
$2,500 |
$2,500 |
|
|
Technical |
$2,000 |
$2,000 |
$2,000 |
$2,000 |
$2,000 |
$2,000 |
$2,000 |
$2,000 |
$2,000 |
$2,000 |
$2,000 |
$2,000 |
|
|
Fulfillment |
$2,000 |
$2,000 |
$2,000 |
$2,000 |
$2,000 |
$2,000 |
$2,000 |
$2,000 |
$2,000 |
$2,000 |
$2,000 |
$2,000 |
|
|
Fulfillment |
$1,500 |
$1,500 |
$1,500 |
$1,500 |
$1,500 |
$1,500 |
$1,500 |
$1,500 |
$1,500 |
$1,500 |
$1,500 |
$1,500 |
|
|
Subtotal |
$9,500 |
$9,500 |
$9,500 |
$9,500 |
$9,500 |
$9,500 |
$9,500 |
$14,500 |
$14,500 |
$14,500 |
$14,500 |
$14,500 |
|
|
Sales and Marketing Personnel |
|||||||||||||
|
Manager |
$6,000 |
$6,000 |
$6,000 |
$6,000 |
$6,000 |
$6,000 |
$6,000 |
$6,000 |
$6,000 |
$6,000 |
$6,000 |
$6,000 |
|
|
Technical Sales |
$5,000 |
$5,000 |
$5,000 |
$5,000 |
$5,000 |
$5,000 |
$5,000 |
$5,000 |
$5,000 |
$5,000 |
$5,000 |
$5,000 |
|
|
Technical Sales |
$3,500 |
$3,500 |
$3,500 |
$3,500 |
$3,500 |
$4,000 |
$4,000 |
$4,000 |
$4,000 |
$4,000 |
$4,000 |
$4,000 |
|
|
Salesperson |
$2,500 |
$2,500 |
$2,500 |
$2,500 |
$2,500 |
$4,000 |
$4,000 |
$4,000 |
$4,000 |
$4,000 |
$4,000 |
$4,000 |
|
|
Salesperson |
$2,500 |
$2,500 |
$2,500 |
$2,500 |
$2,500 |
$4,000 |
$4,000 |
$4,000 |
$4,000 |
$4,000 |
$4,000 |
$4,000 |
|
|
Salesperson |
$2,500 |
$2,500 |
$2,500 |
$2,500 |
$2,500 |
$3,000 |
$3,000 |
$3,000 |
$3,000 |
$3,000 |
$3,000 |
$3,000 |
|
|
Salesperson |
$2,000 |
$2,000 |
$2,000 |
$2,000 |
$2,000 |
$3,000 |
$3,000 |
$3,000 |
$3,000 |
$3,000 |
$3,000 |
$3,000 |
|
|
Salesperson |
$0 |
$0 |
$0 |
$0 |
$0 |
$3,000 |
$3,000 |
$3,000 |
$3,000 |
$3,000 |
$3,000 |
$3,000 |
|
|
Salesperson |
$0 |
$0 |
$0 |
$0 |
$0 |
$0 |
$0 |
$0 |
$0 |
$0 |
$0 |
$0 |
|
|
Subtotal |
$24,000 |
$24,000 |
$24,000 |
$24,000 |
$24,000 |
$32,000 |
$32,000 |
$32,000 |
$32,000 |
$32,000 |
$32,000 |
$32,000 |
|
|
General and Administrative Personnel |
|||||||||||||
|
President |
$5,500 |
$5,500 |
$5,500 |
$5,500 |
$5,500 |
$5,500 |
$5,500 |
$5,500 |
$5,500 |
$5,500 |
$5,500 |
$5,500 |
|
|
Finance |
$0 |
$0 |
$0 |
$0 |
$0 |
$4,000 |
$4,000 |
$4,000 |
$4,000 |
$4,000 |
$4,000 |
$4,000 |
|
|
Admin Assistant |
$2,000 |
$2,000 |
$2,000 |
$2,000 |
$2,000 |
$2,000 |
$2,000 |
$2,000 |
$2,000 |
$2,000 |
$2,000 |
$2,000 |
|
|
Bookkeeping |
$1,500 |
$1,500 |
$1,500 |
$1,500 |
$1,500 |
$1,500 |
$1,500 |
$1,500 |
$1,500 |
$1,500 |
$1,500 |
$1,500 |
|
|
Clerical |
$1,000 |
$1,000 |
$1,000 |
$1,000 |
$1,000 |
$1,000 |
$1,000 |
$1,000 |
$1,000 |
$1,000 |
$1,000 |
$1,000 |
|
|
Clerical |
$0 |
$0 |
$0 |
$0 |
$0 |
$1,000 |
$1,000 |
$1,000 |
$1,000 |
$1,000 |
$1,000 |
$1,000 |
|
|
Clerical |
$0 |
$0 |
$0 |
$0 |
$0 |
$0 |
$0 |
$0 |
$0 |
$0 |
$0 |
$0 |
|
|
Subtotal |
$10,000 |
$10,000 |
$10,000 |
$10,000 |
$10,000 |
$15,000 |
$15,000 |
$15,000 |
$15,000 |
$15,000 |
$15,000 |
$15,000 |
|
|
Other Personnel |
|||||||||||||
|
Programming |
$3,000 |
$3,000 |
$3,000 |
$3,000 |
$3,000 |
$3,000 |
$3,000 |
$3,000 |
$3,000 |
$3,000 |
$3,000 |
$3,000 |
|
|
Other Technical |
$0 |
$0 |
$0 |
$0 |
$0 |
$0 |
$0 |
$0 |
$0 |
$0 |
$0 |
$0 |
|
|
Subtotal |
$3,000 |
$3,000 |
$3,000 |
$3,000 |
$3,000 |
$3,000 |
$3,000 |
$3,000 |
$3,000 |
$3,000 |
$3,000 |
$3,000 |
|
|
Total People |
19 |
19 |
19 |
19 |
19 |
26 |
26 |
26 |
26 |
26 |
26 |
26 |
|
|
Total Payroll |
$46,500 |
$46,500 |
$46,500 |
$46,500 |
$46,500 |
$59,500 |
$59,500 |
$64,500 |
$64,500 |
$64,500 |
$64,500 |
$64,500 |
|
|
Pro Forma Profit and Loss |
|||||||||||||
|
Jan |
Feb |
Mar |
Apr |
May |
Jun |
Jul |
Aug |
Sep |
Oct |
Nov |
Dec |
||
|
Sales |
$268,365 |
$342,025 |
$415,635 |
$701,591 |
$643,894 |
$485,882 |
$362,510 |
$306,128 |
$513,535 |
$754,814 |
$934,107 |
$740,149 |
|
|
Direct Cost of Sales |
$184,510 |
$243,061 |
$301,612 |
$392,087 |
$495,918 |
$360,350 |
$250,185 |
$210,725 |
$364,860 |
$556,072 |
$704,485 |
$556,810 |
|
|
Production Payroll |
$9,500 |
$9,500 |
$9,500 |
$9,500 |
$9,500 |
$9,500 |
$9,500 |
$14,500 |
$14,500 |
$14,500 |
$14,500 |
$14,500 |
|
|
Other Costs of Sales |
$0 |
$0 |
$0 |
$0 |
$0 |
$0 |
$0 |
$0 |
$0 |
$0 |
$0 |
$0 |
|
|
Total Cost of Sales |
$194,010 |
$252,561 |
$311,112 |
$401,587 |
$505,418 |
$369,850 |
$259,685 |
$225,225 |
$379,360 |
$570,572 |
$718,985 |
$571,310 |
|
|
Gross Margin |
$74,356 |
$89,465 |
$104,524 |
$300,004 |
$138,477 |
$116,032 |
$102,825 |
$80,903 |
$134,175 |
$184,242 |
$215,122 |
$168,839 |
|
|
Gross Margin % |
27.71% |
26.16% |
25.15% |
42.76% |
21.51% |
23.88% |
28.36% |
26.43% |
26.13% |
24.41% |
23.03% |
22.81% |
|
|
Operating Expenses |
|||||||||||||
|
Sales and Marketing Expenses |
|||||||||||||
|
Sales and Marketing Payroll |
$24,000 |
$24,000 |
$24,000 |
$24,000 |
$24,000 |
$32,000 |
$32,000 |
$32,000 |
$32,000 |
$32,000 |
$32,000 |
$32,000 |
|
|
Ads |
$5,000 |
$5,000 |
$7,000 |
$10,000 |
$15,000 |
$10,000 |
$4,000 |
$4,000 |
$20,000 |
$15,000 |
$20,000 |
$10,000 |
|
|
Catalog |
$2,000 |
$3,000 |
$2,000 |
$2,000 |
$2,000 |
$2,000 |
$2,000 |
$2,000 |
$2,000 |
$2,000 |
$2,000 |
$2,000 |
|
|
Mailing |
$3,000 |
$11,800 |
$5,500 |
$10,500 |
$10,500 |
$5,500 |
$10,500 |
$10,500 |
$10,500 |
$22,000 |
$8,000 |
$5,000 |
|
|
Promo |
$0 |
$0 |
$0 |
$0 |
$0 |
$0 |
$0 |
$0 |
$1,000 |
$0 |
$15,000 |
$0 |
|
|
Shows |
$0 |
$0 |
$0 |
$0 |
$0 |
$0 |
$3,200 |
$0 |
$10,000 |
$7,000 |
$0 |
$0 |
|
|
Literature |
$0 |
$7,000 |
$0 |
$0 |
$0 |
$0 |
$0 |
$0 |
$0 |
$0 |
$0 |
$0 |
|
|
PR |
$0 |
$0 |
$0 |
$1,000 |
$0 |
$0 |
$0 |
$0 |
$0 |
$0 |
$0 |
$0 |
|
|
Seminar |
$1,000 |
$0 |
$0 |
$5,000 |
$5,000 |
$5,000 |
$5,000 |
$5,000 |
$5,000 |
$0 |
$0 |
$0 |
|
|
Service |
$2,000 |
$1,000 |
$1,000 |
$500 |
$2,500 |
$500 |
$500 |
$500 |
$500 |
$500 |
$500 |
$250 |
|
|
Training |
$450 |
$450 |
$450 |
$450 |
$450 |
$450 |
$450 |
$450 |
$450 |
$450 |
$450 |
$450 |
|
|
Total Sales and Marketing Expenses |
$37,450 |
$52,250 |
$39,950 |
$53,450 |
$59,450 |
$55,450 |
$57,650 |
$54,450 |
$81,450 |
$78,950 |
$77,950 |
$49,700 |
|
|
Sales and Marketing % |
13.95% |
15.28% |
9.61% |
7.62% |
9.23% |
11.41% |
15.90% |
17.79% |
15.86% |
10.46% |
8.34% |
6.71% |
|
|
General and Administrative Expenses |
|||||||||||||
|
General and Administrative Payroll |
$10,000 |
$10,000 |
$10,000 |
$10,000 |
$10,000 |
$15,000 |
$15,000 |
$15,000 |
$15,000 |
$15,000 |
$15,000 |
$15,000 |
|
|
Marketing/Promotion |
$0 |
$0 |
$0 |
$0 |
$0 |
$0 |
$0 |
$0 |
$0 |
$0 |
$0 |
$0 |
|
|
Depreciation |
$1,000 |
$1,010 |
$1,020 |
$1,030 |
$1,040 |
$1,050 |
$1,061 |
$1,072 |
$1,083 |
$1,094 |
$1,105 |
$1,116 |
|
|
Leased Equipment |
$2,500 |
$2,500 |
$2,500 |
$2,500 |
$2,500 |
$2,500 |
$2,500 |
$2,500 |
$2,500 |
$2,500 |
$2,500 |
$2,500 |
|
|
Rent |
$7,000 |
$7,000 |
$7,000 |
$7,000 |
$7,000 |
$7,000 |
$7,000 |
$7,000 |
$7,000 |
$7,000 |
$7,000 |
$7,000 |
|
|
Utilities |
$750 |
$750 |
$750 |
$750 |
$750 |
$750 |
$750 |
$750 |
$750 |
$750 |
$750 |
$750 |
|
|
Insurance |
$500 |
$500 |
$500 |
$500 |
$500 |
$500 |
$500 |
$500 |
$500 |
$500 |
$500 |
$500 |
|
|
Payroll Taxes |
15% |
$0 |
$0 |
$0 |
$0 |
$0 |
$0 |
$0 |
$0 |
$0 |
$0 |
$0 |
$0 |
|
Other General and Administrative Expenses |
$500 |
$505 |
$510 |
$515 |
$520 |
$525 |
$530 |
$535 |
$540 |
$545 |
$550 |
$556 |
|
|
Total General and Administrative Expenses |
$22,250 |
$22,265 |
$22,280 |
$22,295 |
$22,310 |
$27,325 |
$27,341 |
$27,357 |
$27,373 |
$27,389 |
$27,405 |
$27,422 |
|
|
General and Administrative % |
8.29% |
6.51% |
5.36% |
3.18% |
3.46% |
5.62% |
7.54% |
8.94% |
5.33% |
3.63% |
2.93% |
3.70% |
|
|
Other Expenses: |
|||||||||||||
|
Other Payroll |
$3,000 |
$3,000 |
$3,000 |
$3,000 |
$3,000 |
$3,000 |
$3,000 |
$3,000 |
$3,000 |
$3,000 |
$3,000 |
$3,000 |
|
|
Contract/Consultants |
$125 |
$125 |
$125 |
$125 |
$125 |
$125 |
$125 |
$125 |
$125 |
$125 |
$125 |
$125 |
|
|
Other Expenses |
$0 |
$0 |
$0 |
$0 |
$0 |
$0 |
$0 |
$0 |
$0 |
$0 |
$0 |
$0 |
|
|
Total Other Expenses |
$3,125 |
$3,125 |
$3,125 |
$3,125 |
$3,125 |
$3,125 |
$3,125 |
$3,125 |
$3,125 |
$3,125 |
$3,125 |
$3,125 |
|
|
Other % |
1.16% |
0.91% |
0.75% |
0.45% |
0.49% |
0.64% |
0.86% |
1.02% |
0.61% |
0.41% |
0.33% |
0.42% |
|
|
Total Operating Expenses |
$62,825 |
$77,640 |
$65,355 |
$78,870 |
$84,885 |
$85,900 |
$88,116 |
$84,932 |
$111,948 |
$109,464 |
$108,480 |
$80,247 |
|
|
Profit Before Interest and Taxes |
$11,531 |
$11,825 |
$39,169 |
$221,134 |
$53,592 |
$30,132 |
$14,709 |
($4,029) |
$22,227 |
$74,778 |
$106,642 |
$88,592 |
|
|
EBITDA |
$12,531 |
$12,835 |
$40,189 |
$222,164 |
$54,632 |
$31,182 |
$15,770 |
($2,957) |
$23,310 |
$75,872 |
$107,747 |
$89,708 |
|
|
Interest Expense |
$2,580 |
$2,543 |
$3,213 |
$3,175 |
$3,137 |
$3,099 |
$3,060 |
$3,022 |
$2,983 |
$2,944 |
$2,919 |
$2,893 |
|
|
Taxes Incurred |
$1,790 |
$1,856 |
$7,191 |
$43,592 |
$10,091 |
$5,407 |
$3,494 |
($1,410) |
$3,849 |
$14,367 |
$20,745 |
$17,140 |
|
|
Net Profit |
$7,160 |
$7,426 |
$28,764 |
$174,367 |
$40,364 |
$21,626 |
$8,154 |
($5,641) |
$15,395 |
$57,467 |
$82,978 |
$68,559 |
|
|
Net Profit/Sales |
2.67% |
2.17% |
6.92% |
24.85% |
6.27% |
4.45% |
2.25% |
-1.84% |
3.00% |
7.61% |
8.88% |
9.26% |
|
|
Pro Forma Cash Flow |
|||||||||||||
|
Jan |
Feb |
Mar |
Apr |
May |
Jun |
Jul |
Aug |
Sep |
Oct |
Nov |
Dec |
||
|
Cash Received |
|||||||||||||
|
Cash from Operations |
|||||||||||||
|
Cash Sales |
$40,255 |
$51,304 |
$62,345 |
$105,239 |
$96,584 |
$72,882 |
$54,376 |
$45,919 |
$77,030 |
$113,222 |
$140,116 |
$111,022 |
|
|
Cash from Receivables |
$197,554 |
$205,157 |
$230,197 |
$292,807 |
$361,392 |
$594,717 |
$542,833 |
$409,504 |
$306,536 |
$266,085 |
$443,341 |
$646,672 |
|
|
Subtotal Cash from Operations |
$237,808 |
$256,461 |
$292,543 |
$398,045 |
$457,976 |
$667,599 |
$597,210 |
$455,423 |
$383,566 |
$379,307 |
$583,457 |
$757,694 |
|
|
Additional Cash Received |
|||||||||||||
|
Sales Tax, VAT, HST/GST Received |
0.00% |
$0 |
$0 |
$0 |
$0 |
$0 |
$0 |
$0 |
$0 |
$0 |
$0 |
$0 |
$0 |
|
New Current Borrowing |
$0 |
$0 |
$0 |
$0 |
$0 |
$0 |
$0 |
$0 |
$0 |
$0 |
$0 |
$0 |
|
|
New Other Liabilities (interest-free) |
$0 |
$0 |
$0 |
$0 |
$0 |
$0 |
$0 |
$0 |
$0 |
$0 |
$0 |
$0 |
|
|
New Long-term Liabilities |
$0 |
$0 |
$100,000 |
$0 |
$0 |
$0 |
$0 |
$0 |
$0 |
$0 |
$0 |
$0 |
|
|
Sales of Other Current Assets |
$0 |
$0 |
$0 |
$0 |
$0 |
$0 |
$0 |
$0 |
$0 |
$0 |
$0 |
$0 |
|
|
Sales of Long-term Assets |
$0 |
$0 |
$0 |
$0 |
$0 |
$0 |
$0 |
$0 |
$0 |
$0 |
$0 |
$0 |
|
|
New Investment Received |
$0 |
$0 |
$0 |
$0 |
$0 |
$0 |
$0 |
$0 |
$0 |
$0 |
$0 |
$0 |
|
|
Subtotal Cash Received |
$237,808 |
$256,461 |
$392,543 |
$398,045 |
$457,976 |
$667,599 |
$597,210 |
$455,423 |
$383,566 |
$379,307 |
$583,457 |
$757,694 |
|
|
Expenditures |
Jan |
Feb |
Mar |
Apr |
May |
Jun |
Jul |
Aug |
Sep |
Oct |
Nov |
Dec |
|
|
Expenditures from Operations |
|||||||||||||
|
Cash Spending |
$46,500 |
$46,500 |
$46,500 |
$46,500 |
$46,500 |
$59,500 |
$59,500 |
$64,500 |
$64,500 |
$64,500 |
$64,500 |
$64,500 |
|
|
Bill Payments |
$224,870 |
$29,690 |
$51,343 |
$273,659 |
$573,158 |
$646,765 |
$265,321 |
$184,400 |
$219,402 |
$594,568 |
$826,664 |
$918,082 |
|
|
Subtotal Spent on Operations |
$271,370 |
$76,190 |
$97,843 |
$320,159 |
$619,658 |
$706,265 |
$324,821 |
$248,900 |
$283,902 |
$659,068 |
$891,164 |
$982,582 |
|
|
Additional Cash Spent |
|||||||||||||
|
Sales Tax, VAT, HST/GST Paid Out |
$0 |
$0 |
$0 |
$0 |
$0 |
$0 |
$0 |
$0 |
$0 |
$0 |
$0 |
$0 |
|
|
Principal Repayment of Current Borrowing |
$2,500 |
$2,500 |
$2,500 |
$2,500 |
$2,500 |
$2,500 |
$2,500 |
$2,500 |
$2,500 |
$2,500 |
$500 |
$500 |
|
|
Other Liabilities Principal Repayment |
$0 |
$0 |
$0 |
$0 |
$0 |
$0 |
$0 |
$0 |
$0 |
$0 |
$0 |
$0 |
|
|
Long-term Liabilities Principal Repayment |
$2,942 |
$2,962 |
$2,983 |
$3,005 |
$3,026 |
$3,047 |
$3,069 |
$3,091 |
$3,113 |
$3,135 |
$3,157 |
$3,179 |
|
|
Purchase Other Current Assets |
$0 |
$0 |
$0 |
$0 |
$0 |
$0 |
$0 |
$0 |
$0 |
$0 |
$0 |
$0 |
|
|
Purchase Long-term Assets |
$0 |
$0 |
$0 |
$0 |
$0 |
$0 |
$0 |
$0 |
$0 |
$0 |
$0 |
$0 |
|
|
Dividends |
$0 |
$0 |
$0 |
$0 |
$0 |
$0 |
$0 |
$0 |
$0 |
$0 |
$0 |
$0 |
|
|
Subtotal Cash Spent |
$276,812 |
$81,652 |
$103,326 |
$325,664 |
$625,184 |
$711,812 |
$330,390 |
$254,491 |
$289,515 |
$664,703 |
$894,821 |
$986,261 |
|
|
Net Cash Flow |
($39,004) |
$174,809 |
$289,217 |
$72,382 |
($167,208) |
($44,212) |
$266,820 |
$200,932 |
$94,051 |
($285,395) |
($311,364) |
($228,566) |
|
|
Cash Balance |
$16,428 |
$191,237 |
$480,454 |
$552,836 |
$385,628 |
$341,416 |
$608,235 |
$809,167 |
$903,218 |
$617,823 |
$306,459 |
$77,893 |
|
|
Pro Forma Balance Sheet |
|||||||||||||
|
Jan |
Feb |
Mar |
Apr |
May |
Jun |
Jul |
Aug |
Sep |
Oct |
Nov |
Dec |
||
|
Assets |
Starting Balances |
||||||||||||
|
Current Assets |
|||||||||||||
|
Cash |
$55,432 |
$16,428 |
$191,237 |
$480,454 |
$552,836 |
$385,628 |
$341,416 |
$608,235 |
$809,167 |
$903,218 |
$617,823 |
$306,459 |
$77,893 |
|
Accounts Receivable |
$395,107 |
$425,664 |
$511,228 |
$634,320 |
$937,865 |
$1,123,784 |
$942,066 |
$707,366 |
$558,071 |
$688,040 |
$1,063,547 |
$1,414,196 |
$1,396,650 |
|
Inventory |
$805,098 |
$620,589 |
$377,528 |
$301,612 |
$392,087 |
$495,918 |
$360,350 |
$250,185 |
$210,725 |
$364,860 |
$556,072 |
$704,485 |
$556,810 |
|
Other Current Assets |
$25,000 |
$25,000 |
$25,000 |
$25,000 |
$25,000 |
$25,000 |
$25,000 |
$25,000 |
$25,000 |
$25,000 |
$25,000 |
$25,000 |
$25,000 |
|
Total Current Assets |
$1,280,637 |
$1,087,680 |
$1,104,993 |
$1,441,386 |
$1,907,788 |
$2,030,329 |
$1,668,832 |
$1,590,786 |
$1,602,963 |
$1,981,119 |
$2,262,442 |
$2,450,140 |
$2,056,353 |
|
Long-term Assets |
|||||||||||||
|
Long-term Assets |
$350,000 |
$350,000 |
$350,000 |
$350,000 |
$350,000 |
$350,000 |
$350,000 |
$350,000 |
$350,000 |
$350,000 |
$350,000 |
$350,000 |
$350,000 |
|
Accumulated Depreciation |
$50,000 |
$51,000 |
$52,010 |
$53,030 |
$54,060 |
$55,100 |
$56,150 |
$57,211 |
$58,283 |
$59,366 |
$60,460 |
$61,565 |
$62,681 |
|
Total Long-term Assets |
$300,000 |
$299,000 |
$297,990 |
$296,970 |
$295,940 |
$294,900 |
$293,850 |
$292,789 |
$291,717 |
$290,634 |
$289,540 |
$288,435 |
$287,319 |
|
Total Assets |
$1,580,637 |
$1,386,680 |
$1,402,983 |
$1,738,356 |
$2,203,728 |
$2,325,229 |
$1,962,682 |
$1,883,575 |
$1,894,680 |
$2,271,753 |
$2,551,982 |
$2,738,575 |
$2,343,672 |
|
Liabilities and Capital |
Jan |
Feb |
Mar |
Apr |
May |
Jun |
Jul |
Aug |
Sep |
Oct |
Nov |
Dec |
|
|
Current Liabilities |
|||||||||||||
|
Accounts Payable |
$223,897 |
$28,222 |
$42,561 |
$254,653 |
$551,164 |
$637,827 |
$259,200 |
$177,509 |
$199,845 |
$567,136 |
$795,533 |
$902,805 |
$443,022 |
|
Current Borrowing |
$90,000 |
$87,500 |
$85,000 |
$82,500 |
$80,000 |
$77,500 |
$75,000 |
$72,500 |
$70,000 |
$67,500 |
$65,000 |
$64,500 |
$64,000 |
|
Other Current Liabilities |
$15,000 |
$15,000 |
$15,000 |
$15,000 |
$15,000 |
$15,000 |
$15,000 |
$15,000 |
$15,000 |
$15,000 |
$15,000 |
$15,000 |
$15,000 |
|
Subtotal Current Liabilities |
$328,897 |
$130,722 |
$142,561 |
$352,153 |
$646,164 |
$730,327 |
$349,200 |
$265,009 |
$284,845 |
$649,636 |
$875,533 |
$982,305 |
$522,022 |
|
Long-term Liabilities |
$284,862 |
$281,920 |
$278,958 |
$375,975 |
$372,970 |
$369,944 |
$366,897 |
$363,828 |
$360,737 |
$357,624 |
$354,489 |
$351,332 |
$348,153 |
|
Total Liabilities |
$613,759 |
$412,642 |
$421,519 |
$728,128 |
$1,019,134 |
$1,100,271 |
$716,097 |
$628,837 |
$645,582 |
$1,007,260 |
$1,230,022 |
$1,333,637 |
$870,175 |
|
Paid-in Capital |
$500,000 |
$500,000 |
$500,000 |
$500,000 |
$500,000 |
$500,000 |
$500,000 |
$500,000 |
$500,000 |
$500,000 |
$500,000 |
$500,000 |
$500,000 |
|
Retained Earnings |
$418,355 |
$466,878 |
$466,878 |
$466,878 |
$466,878 |
$466,878 |
$466,878 |
$466,878 |
$466,878 |
$466,878 |
$466,878 |
$466,878 |
$466,878 |
|
Earnings |
$48,523 |
$7,160 |
$14,586 |
$43,350 |
$217,717 |
$258,080 |
$279,707 |
$287,860 |
$282,220 |
$297,615 |
$355,082 |
$438,060 |
$506,619 |
|
Total Capital |
$966,878 |
$974,038 |
$981,464 |
$1,010,228 |
$1,184,595 |
$1,224,958 |
$1,246,585 |
$1,254,738 |
$1,249,098 |
$1,264,493 |
$1,321,960 |
$1,404,938 |
$1,473,497 |
|
Total Liabilities and Capital |
$1,580,637 |
$1,386,680 |
$1,402,983 |
$1,738,356 |
$2,203,728 |
$2,325,229 |
$1,962,682 |
$1,883,575 |
$1,894,680 |
$2,271,753 |
$2,551,982 |
$2,738,575 |
$2,343,672 |
|
Net Worth |
$966,878 |
$974,038 |
$981,464 |
$1,010,228 |
$1,184,595 |
$1,224,958 |
$1,246,585 |
$1,254,738 |
$1,249,098 |
$1,264,493 |
$1,321,960 |
$1,404,938 |
$1,473,497 |