Video Production Business Plan
Michael's Video Service
Executive Summary
Michael's Video Service uses the latest technology to provide video production services. This means that the services provided achieve a level of quality previously reserved for only the most expensive video production companies.
Michael's Video Service is a new company and as such, we will need to meet market acceptance. To that end, the company is working to determine trends in the industry, the needs of the customer, and how best to address the needs of the customer.
Our services are geared for several markets, including television stations, companies, high schools, and families. We will initially target high schools with whom we can establish strategic alliances that will enable us to establish long term relationships with them. In our first year of operation, we believe we can capture 15 to 25% of the market, which translates into $100,000 - $130,000 in sales.
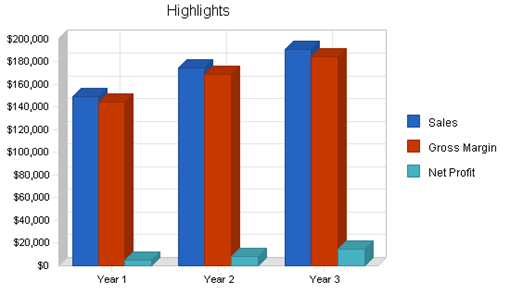
We believe that we can earn $149,000 in our first year, rising to $175,000 and $191,000 in our second and third years, respectively. Our market strategy will be to advertise and capitalize on the services that our competitors do not offer.
There are several companies with whom we will be competing. We have a competitive advantage, however, because our equipment is more aligned with the video production industry trends requiring digital technology, as opposed to analog devices.
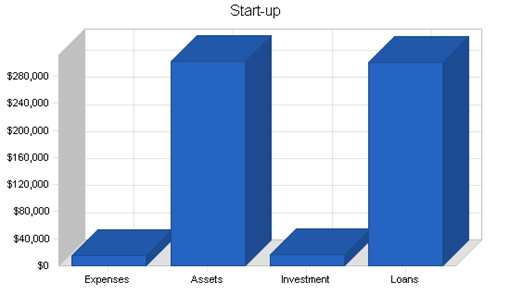
The company is seeking a loan in the amount of $300,000 which will be used to purchase the equipment and start-up expenses. The company's revenue projections for the first three years are $149,000, $175,000, and $191,000, respectively. Michael's Video Service expects to achieve profitability early on.
Company Summary
Legal Business Description
Michael's Video Service was founded in May 1996 by Mr. Michael Morrison. Michael's Video Service is a Limited Liability Company (LLC) with principal offices located in Denton, Ohio.
|
Start-up Funding |
|
|
Start-up Expenses to Fund |
$15,000 |
|
Start-up Assets to Fund |
$302,000 |
|
Total Funding Required |
$317,000 |
|
Assets |
|
|
Non-cash Assets from Start-up |
$242,000 |
|
Cash Requirements from Start-up |
$60,000 |
|
Additional Cash Raised |
$0 |
|
Cash Balance on Starting Date |
$60,000 |
|
Total Assets |
$302,000 |
|
Liabilities and Capital |
|
|
Liabilities |
|
|
Current Borrowing |
$0 |
|
Long-term Liabilities |
$300,000 |
|
Accounts Payable (Outstanding Bills) |
$0 |
|
Other Current Liabilities (interest-free) |
$0 |
|
Total Liabilities |
$300,000 |
|
Capital |
|
|
Planned Investment |
|
|
Michael Morisson |
$17,000 |
|
Other |
$0 |
|
Additional Investment Requirement |
$0 |
|
Total Planned Investment |
$17,000 |
|
Loss at Start-up (Start-up Expenses) |
($15,000) |
|
Total Capital |
$2,000 |
|
Total Capital and Liabilities |
$302,000 |
|
Total Funding |
$317,000 |
2.1 Mission
Our mission is to become the leading freelance and video production company in state, utilizing the latest technology to shift market share from competitors to Michael's Video Service.
|
Start-up |
|
|
Requirements |
|
|
Start-up Expenses |
|
|
Legal |
$500 |
|
Stationery etc. |
$200 |
|
Brochures |
$300 |
|
Consultants |
$1,000 |
|
Insurance |
$1,200 |
|
Rent |
$600 |
|
Expensed equipment |
$10,000 |
|
Other |
$1,200 |
|
Total Start-up Expenses |
$15,000 |
|
Start-up Assets |
|
|
Cash Required |
$60,000 |
|
Start-up Inventory |
$2,000 |
|
Other Current Assets |
$0 |
|
Long-term Assets |
$240,000 |
|
Total Assets |
$302,000 |
|
Total Requirements |
$317,000 |
Services
Michael's Video Service is in business to cover events and special occasions on a freelance basis. What we will be providing is an alternative solution for video companies or out of town television stations. Instead of them sending a crew or taking time out of their busy schedules, they can hire us to do the filming for them. This gives them the opportunity to focus on their core competencies.
We will attend any and every event that we will have to cover for our customer. Using our experience, we will find a strategic location from which we will film. Once the filming is complete, we will then deliver the tape to the customer.
Michael's Video Service will contract video services to its target markets. Services are not only limited to the Denton, we are able to travel around the country. Our main goal is to contract our services to anyone who may need an event video taped.
3.1 Service Description
The operation begins with the customer contacting Michael's Video Service with the intent of using our services. All the details of the event are gathered and all the relevant information pertaining the specific requirements, as well as the delivery of the tape. Thereafter, we attend the event and proceed to do the filming. Once the filming is completed, the next step is to deliver the tape to the customer.
3.2 Technology
Background
Analog is the old technology and digital is the new. Analog communication systems involve the amplitude modulation of a radio signal. In other words, they transmit and receive information through a continuous flow of electromagnetic signals. An inherent weakness of the technology is that analog signals weaken over distances and require additional equipment to boost them as they travel.
Digital cameras are the future of television broadcasting as well as the future of consumer camcorders. The FCC has mandated that all television stations must transmit a digital signal to the homes of its viewers by 2002.
In keeping up with the trends in the industry, we plan to purchase the latest digital equipment on the market. We plan to use the following equipment:
- DLC Qualcomm 500
- Sanyo 2000 video equipment
- Sanyo 2000 wireless equipment
Strategy and Implementation
We plan to initially market our products and services as an alternative solution for television networks and video companies. These markets were selected because of their size, trends in technology, our experience with video production, our industry contacts, and an overall belief that they are most appropriate to initially target.
We aim to rapidly develop alliances with the major high schools to enable us to gain credibility as the best video production company. Our market strategy will be to advertise and capitalize on the products and services that our competitors do not have.
4.1 Market Analysis Summary
We expect to compete as a freelance video production company in the broadcasting industry. Companies in the industry are involved in the creation and delivery of various types of programming to consumers. Much of that programming is recorded on film, tape, or disk, so that it can be seen or heard repeatedly by both new audiences and those that are familiar with it. Many of the events that are broadcast live are likely to be recorded, with some or all of such events to be rebroadcast at future times.
Within this national market, Michael's Video Service will initially focus on supplying its services to the high school market market. We intend to be the only freelance video company in the city and state to offer our services to companies of any size. Our goal is to be on the freelance list for all the major television networks for news and sports coverage in the southeast region of the United States.
4.1.1 Market Segmentation
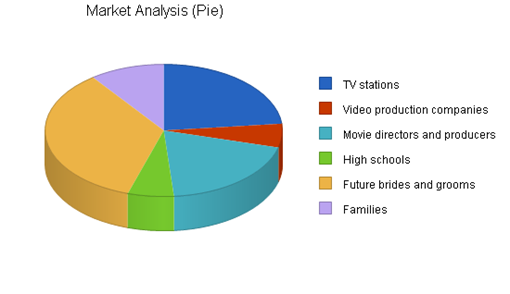
Our customer is defined as any individual or organization that has need for one of the services we provide. Our target customers are as follows.
- Television stations
- Video production companies
- Movie directors and producers
- High schools
- Future brides and grooms
- Families
|
Market Analysis |
|||||||
|
Year 1 |
Year 2 |
Year 3 |
Year 4 |
Year 5 |
|||
|
Potential Customers |
Growth |
CAGR |
|||||
|
TV stations |
5% |
600 |
630 |
662 |
695 |
730 |
5.03% |
|
Video production companies |
10% |
150 |
165 |
182 |
200 |
220 |
10.05% |
|
Movie directors and producers |
10% |
500 |
550 |
605 |
666 |
733 |
10.04% |
|
High schools |
5% |
160 |
168 |
176 |
185 |
194 |
4.94% |
|
Future brides and grooms |
20% |
900 |
1,080 |
1,296 |
1,555 |
1,866 |
20.00% |
|
Families |
15% |
260 |
299 |
344 |
396 |
455 |
15.02% |
|
Total |
13.05% |
2,570 |
2,892 |
3,265 |
3,697 |
4,198 |
13.05% |
4.1.2 Competition and Buying Patterns
Customers are expected to use our services based on traditional factors:
- Price
- Performance
- Flexibility
- Expertise
4.1.3 Distribution Strategy
We plan to market our services through diverse channels including the radio, print advertising, and television. These channels are most appropriate initially because we are seeking to gain recognition in the industry. Another element of distribution is our plan to work with established video production companies. This will provide access to their distribution channels and reduce our marketing costs.
4.1.4 Service Business Analysis
The major companies that compete in the market are:
- Synergy Productions
- Local Television Stations
- Video Production, Inc.
- Gene's Video Productions
- Denton Video Service
- VIP Productions
All of our competitors specialize in one aspect of video production. We are a diversified company and we believe that there will be no down period for us. We are not seasonal based, our services are offered throughout the year. With our diversity, we will be able to attract the larger organizations that like to entrust one company to handle all of their affairs.
4.1.4.1 Possible Barriers to Entry
Michael's Video Service will benefit from several significant barriers to entry which include:
- Equipment
- Strategic Alliances
- Experience in the field
4.1.5 Strategic Alliances
The company plans to form strategic alliances with clients who require a freelancer to cover various events for them. Michael's Video Service will also develop strategic alliances with video production companies and work with them as a sub-contractor.
4.1.6 Value Proposition
By using Michael's Video Service to cover various events for them, companies will be able to save time. They can then use this time saved to focus on their core competencies and the things that they do best. We are in business to provide a service that is second to none. As such, we guarantee that our customers will receive first class service and a final product that is well worth the money invested. To that end, we guarantee a full refund in the event that a customer is not satisfied. At Michael's Video Service, we take pride in our work and it is our aim to be the best at what we do. We will conduct our business in a professional manner from our methods and character to our standards and ethics.
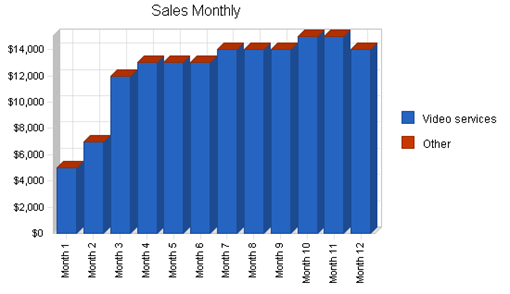
4.2 Sales Forecast
The following table and chart show our planned sales.
|
Sales Forecast |
|||
|
Year 1 |
Year 2 |
Year 3 |
|
|
Sales |
|||
|
Video services |
$149,000 |
$175,000 |
$191,000 |
|
Other |
$0 |
$0 |
$0 |
|
Total Sales |
$149,000 |
$175,000 |
$191,000 |
|
Direct Cost of Sales |
Year 1 |
Year 2 |
Year 3 |
|
Video services |
$4,800 |
$5,700 |
$6,600 |
|
Other |
$0 |
$0 |
$0 |
|
Subtotal Direct Cost of Sales |
$4,800 |
$5,700 |
$6,600 |
4.2.1 Channels
Sales, Distribution, and Marketing Channels
In marketing our products and services, we will rely on a combination of the following channels:
- Direct approach
- Yellow pages
- Website
- Radio and television
- Mail order
- Word of mouth
- Trade shows
Alliances with video companies that have industry credibility, presence, and distribution are key to our strategy. In monitoring our services and market position, we will rely on feedback from customers with whom we have relationships. This will be done through direct sales. The message associated with our products and services is high quality for less money. Our promotional plan is diverse and will include a range of marketing communications.
4.2.2 Pricing Strategy
We plan to set our pricing based on market value. Our actual price will be based on whether our services are required on a daily or an hourly basis. It is anticipated that we will charge $300 per hour and $1,000 per day. For out of town travel, additional charges will be added for expenses.
Management Summary
The company's management philosophy will be based on responsibility and mutual respect. Michael Video Services will maintain an environment and structure that will encourage productivity and respect for customers and fellow employees. Additionally, the environment will encourage employees to have fun by allowing creative independence and providing challenges that are realistic and rewarding.
Michael's Video Service's management team is highly experienced and qualified. The management team is lead by Mr. Michael Morisson.
|
Personnel Plan |
|||
|
Year 1 |
Year 2 |
Year 3 |
|
|
Michael Morisson |
$30,000 |
$32,000 |
$34,000 |
|
Other |
$18,000 |
$30,000 |
$32,000 |
|
Total People |
2 |
3 |
3 |
|
Total Payroll |
$48,000 |
$62,000 |
$66,000 |
Financial Plan
We are requesting a loan of $300,000. The funds will be used to purchase video equipment and to cover initial operating expenses.
Payback Strategy
Our repayment for this loan will come from cash in excess of profits, paid monthly. The increase in profits generated by business from television stations will provide funds to repay the loan in 10 years.
6.1 Important Assumptions
The table below highlights some assumptions that are key to the success of the company.
|
General Assumptions |
|||
|
Year 1 |
Year 2 |
Year 3 |
|
|
Plan Month |
1 |
2 |
3 |
|
Current Interest Rate |
10.00% |
10.00% |
10.00% |
|
Long-term Interest Rate |
10.00% |
10.00% |
10.00% |
|
Tax Rate |
25.42% |
25.00% |
25.42% |
|
Other |
0 |
0 |
0 |
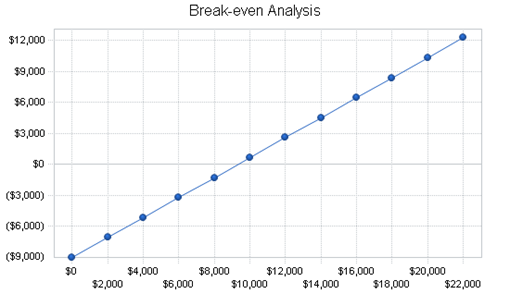
6.2 Break-even Analysis
For our Break-even Analysis, we assume running costs of approximately $9,000 per month, which includes gas, phone, and an estimation of other running costs. Variable costs mostly include video tapes. The chart and table below show our break-even point.
|
Break-even Analysis |
|
|
Monthly Revenue Break-even |
$9,351 |
|
Assumptions: |
|
|
Average Percent Variable Cost |
3% |
|
Estimated Monthly Fixed Cost |
$9,050 |
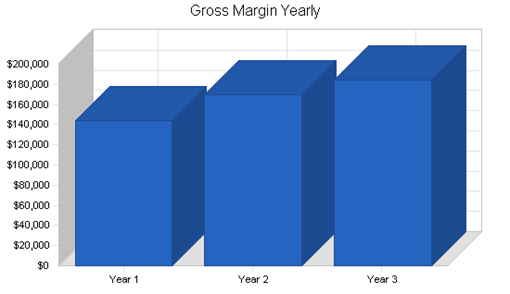
6.3 Projected Profit and Loss
The table below provides the projected income statements for Michael's Video Service. The company is basing its revenue projections on anticipated sales of services, initially to the television networks and video companies, then to other markets such as high school events and weddings.
|
Pro Forma Profit and Loss |
|||
|
Year 1 |
Year 2 |
Year 3 |
|
|
Sales |
$149,000 |
$175,000 |
$191,000 |
|
Direct Cost of Sales |
$4,800 |
$5,700 |
$6,600 |
|
Other |
$0 |
$0 |
$0 |
|
Total Cost of Sales |
$4,800 |
$5,700 |
$6,600 |
|
Gross Margin |
$144,200 |
$169,300 |
$184,400 |
|
Gross Margin % |
96.78% |
96.74% |
96.54% |
|
Expenses |
|||
|
Payroll |
$48,000 |
$62,000 |
$66,000 |
|
Sales and Marketing and Other Expenses |
$18,600 |
$21,400 |
$24,600 |
|
Depreciation |
$24,000 |
$24,000 |
$24,000 |
|
Gas |
$4,800 |
$5,700 |
$6,600 |
|
Utilities & phone |
$2,400 |
$3,000 |
$3,600 |
|
Rent |
$3,600 |
$3,600 |
$3,600 |
|
Payroll Taxes |
$7,200 |
$9,300 |
$9,900 |
|
Other |
$0 |
$0 |
$0 |
|
Total Operating Expenses |
$108,600 |
$129,000 |
$138,300 |
|
Profit Before Interest and Taxes |
$35,600 |
$40,300 |
$46,100 |
|
EBITDA |
$59,600 |
$64,300 |
$70,100 |
|
Interest Expense |
$30,000 |
$28,984 |
$26,844 |
|
Taxes Incurred |
$1,065 |
$2,829 |
$4,894 |
|
Net Profit |
$4,535 |
$8,487 |
$14,362 |
|
Net Profit/Sales |
3.04% |
4.85% |
7.52% |
6.4 Financial Risks and Contingencies
The company recognizes that it is subject to both market and industry risks. We believe our risks are as follows, and we are addressing each as indicated. We face all the risks associated with being a start-up company. We feel that we can overcome these with our experience in the industry and by quickly establishing desired relationships. The economy in south Ohio is based on the oil and gas industry, which is very unstable. Having seen the oil bust in the 1980's and its effects on the economy, we have diversified our efforts and will be going after markets that will not be affected by fluctuations in the oil and gas industry.
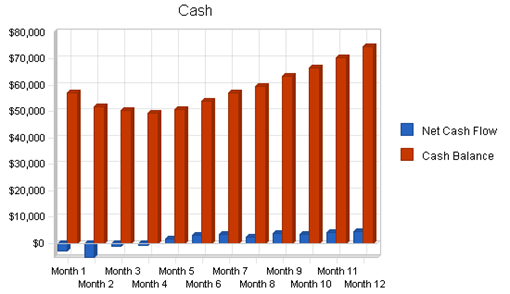
6.5 Projected Cash Flow
The following chart and table present the cash flow assumptions for the company.
|
Pro Forma Cash Flow |
|||
|
Year 1 |
Year 2 |
Year 3 |
|
|
Cash Received |
|||
|
Cash from Operations |
|||
|
Cash Sales |
$37,250 |
$43,750 |
$47,750 |
|
Cash from Receivables |
$90,375 |
$127,520 |
$140,955 |
|
Subtotal Cash from Operations |
$127,625 |
$171,270 |
$188,705 |
|
Additional Cash Received |
|||
|
Sales Tax, VAT, HST/GST Received |
$0 |
$0 |
$0 |
|
New Current Borrowing |
$0 |
$0 |
$0 |
|
New Other Liabilities (interest-free) |
$0 |
$0 |
$0 |
|
New Long-term Liabilities |
$0 |
$0 |
$0 |
|
Sales of Other Current Assets |
$0 |
$0 |
$0 |
|
Sales of Long-term Assets |
$0 |
$0 |
$0 |
|
New Investment Received |
$0 |
$0 |
$0 |
|
Subtotal Cash Received |
$127,625 |
$171,270 |
$188,705 |
|
Expenditures |
Year 1 |
Year 2 |
Year 3 |
|
Expenditures from Operations |
|||
|
Cash Spending |
$48,000 |
$62,000 |
$66,000 |
|
Bill Payments |
$64,802 |
$80,965 |
$86,360 |
|
Subtotal Spent on Operations |
$112,802 |
$142,965 |
$152,360 |
|
Additional Cash Spent |
|||
|
Sales Tax, VAT, HST/GST Paid Out |
$0 |
$0 |
$0 |
|
Principal Repayment of Current Borrowing |
$0 |
$0 |
$0 |
|
Other Liabilities Principal Repayment |
$0 |
$0 |
$0 |
|
Long-term Liabilities Principal Repayment |
$0 |
$20,330 |
$22,458 |
|
Purchase Other Current Assets |
$0 |
$0 |
$0 |
|
Purchase Long-term Assets |
$0 |
$0 |
$0 |
|
Dividends |
$0 |
$0 |
$0 |
|
Subtotal Cash Spent |
$112,802 |
$163,295 |
$174,818 |
|
Net Cash Flow |
$14,823 |
$7,975 |
$13,887 |
|
Cash Balance |
$74,823 |
$82,798 |
$96,685 |
6.6 Projected Balance Sheet
Projected balance sheets are provided below.
|
Pro Forma Balance Sheet |
|||
|
Year 1 |
Year 2 |
Year 3 |
|
|
Assets |
|||
|
Current Assets |
|||
|
Cash |
$74,823 |
$82,798 |
$96,685 |
|
Accounts Receivable |
$21,375 |
$25,105 |
$27,400 |
|
Inventory |
$1,200 |
$1,425 |
$1,650 |
|
Other Current Assets |
$0 |
$0 |
$0 |
|
Total Current Assets |
$97,398 |
$109,328 |
$125,736 |
|
Long-term Assets |
|||
|
Long-term Assets |
$240,000 |
$240,000 |
$240,000 |
|
Accumulated Depreciation |
$24,000 |
$48,000 |
$72,000 |
|
Total Long-term Assets |
$216,000 |
$192,000 |
$168,000 |
|
Total Assets |
$313,398 |
$301,328 |
$293,736 |
|
Liabilities and Capital |
Year 1 |
Year 2 |
Year 3 |
|
Current Liabilities |
|||
|
Accounts Payable |
$6,863 |
$6,636 |
$7,139 |
|
Current Borrowing |
$0 |
$0 |
$0 |
|
Other Current Liabilities |
$0 |
$0 |
$0 |
|
Subtotal Current Liabilities |
$6,863 |
$6,636 |
$7,139 |
|
Long-term Liabilities |
$300,000 |
$279,670 |
$257,212 |
|
Total Liabilities |
$306,863 |
$286,306 |
$264,351 |
|
Paid-in Capital |
$17,000 |
$17,000 |
$17,000 |
|
Retained Earnings |
($15,000) |
($10,465) |
($1,978) |
|
Earnings |
$4,535 |
$8,487 |
$14,362 |
|
Total Capital |
$6,535 |
$15,022 |
$29,384 |
|
Total Liabilities and Capital |
$313,398 |
$301,328 |
$293,736 |
|
Net Worth |
$6,535 |
$15,022 |
$29,384 |
6.7 Business Ratios
The following table presents important business ratios from the motion picture production industry, as determined by the Standard Industry Classification (SIC) Index code 7812, Motion Picture and Video Production.
|
Ratio Analysis |
||||
|
Year 1 |
Year 2 |
Year 3 |
Industry Profile |
|
|
Sales Growth |
0.00% |
17.45% |
9.14% |
0.00% |
|
Percent of Total Assets |
||||
|
Accounts Receivable |
6.82% |
8.33% |
9.33% |
0.00% |
|
Inventory |
0.38% |
0.47% |
0.56% |
0.00% |
|
Other Current Assets |
0.00% |
0.00% |
0.00% |
100.00% |
|
Total Current Assets |
31.08% |
36.28% |
42.81% |
100.00% |
|
Long-term Assets |
68.92% |
63.72% |
57.19% |
0.00% |
|
Total Assets |
100.00% |
100.00% |
100.00% |
100.00% |
|
Current Liabilities |
2.19% |
2.20% |
2.43% |
0.00% |
|
Long-term Liabilities |
95.72% |
92.81% |
87.57% |
0.00% |
|
Total Liabilities |
97.91% |
95.01% |
90.00% |
0.00% |
|
Net Worth |
2.09% |
4.99% |
10.00% |
100.00% |
|
Percent of Sales |
||||
|
Sales |
100.00% |
100.00% |
100.00% |
100.00% |
|
Gross Margin |
96.78% |
96.74% |
96.54% |
0.00% |
|
Selling, General & Administrative Expenses |
93.96% |
91.89% |
88.98% |
0.00% |
|
Advertising Expenses |
4.03% |
4.00% |
4.19% |
0.00% |
|
Profit Before Interest and Taxes |
23.89% |
23.03% |
24.14% |
0.00% |
|
Main Ratios |
||||
|
Current |
14.19 |
16.48 |
17.61 |
0.00 |
|
Quick |
14.02 |
16.26 |
17.38 |
0.00 |
|
Total Debt to Total Assets |
97.91% |
95.01% |
90.00% |
0.00% |
|
Pre-tax Return on Net Worth |
85.69% |
75.33% |
65.53% |
0.00% |
|
Pre-tax Return on Assets |
1.79% |
3.76% |
6.56% |
0.00% |
|
Additional Ratios |
Year 1 |
Year 2 |
Year 3 |
|
|
Net Profit Margin |
3.04% |
4.85% |
7.52% |
n.a |
|
Return on Equity |
69.40% |
56.50% |
48.88% |
n.a |
|
Activity Ratios |
||||
|
Accounts Receivable Turnover |
5.23 |
5.23 |
5.23 |
n.a |
|
Collection Days |
57 |
65 |
67 |
n.a |
|
Inventory Turnover |
4.50 |
4.34 |
4.29 |
n.a |
|
Accounts Payable Turnover |
10.44 |
12.17 |
12.17 |
n.a |
|
Payment Days |
27 |
31 |
29 |
n.a |
|
Total Asset Turnover |
0.48 |
0.58 |
0.65 |
n.a |
|
Debt Ratios |
||||
|
Debt to Net Worth |
46.96 |
19.06 |
9.00 |
n.a |
|
Current Liab. to Liab. |
0.02 |
0.02 |
0.03 |
n.a |
|
Liquidity Ratios |
||||
|
Net Working Capital |
$90,535 |
$102,692 |
$118,596 |
n.a |
|
Interest Coverage |
1.19 |
1.39 |
1.72 |
n.a |
|
Additional Ratios |
||||
|
Assets to Sales |
2.10 |
1.72 |
1.54 |
n.a |
|
Current Debt/Total Assets |
2% |
2% |
2% |
n.a |
|
Acid Test |
10.90 |
12.48 |
13.54 |
n.a |
|
Sales/Net Worth |
22.80 |
11.65 |
6.50 |
n.a |
|
Dividend Payout |
0.00 |
0.00 |
0.00 |
n.a |
Appendix
|
Sales Forecast |
|||||||||||||
|
Month 1 |
Month 2 |
Month 3 |
Month 4 |
Month 5 |
Month 6 |
Month 7 |
Month 8 |
Month 9 |
Month 10 |
Month 11 |
Month 12 |
||
|
Sales |
|||||||||||||
|
Video services |
0% |
$5,000 |
$7,000 |
$12,000 |
$13,000 |
$13,000 |
$13,000 |
$14,000 |
$14,000 |
$14,000 |
$15,000 |
$15,000 |
$14,000 |
|
Other |
0% |
$0 |
$0 |
$0 |
$0 |
$0 |
$0 |
$0 |
$0 |
$0 |
$0 |
$0 |
$0 |
|
Total Sales |
$5,000 |
$7,000 |
$12,000 |
$13,000 |
$13,000 |
$13,000 |
$14,000 |
$14,000 |
$14,000 |
$15,000 |
$15,000 |
$14,000 |
|
|
Direct Cost of Sales |
Month 1 |
Month 2 |
Month 3 |
Month 4 |
Month 5 |
Month 6 |
Month 7 |
Month 8 |
Month 9 |
Month 10 |
Month 11 |
Month 12 |
|
|
Video services |
$400 |
$400 |
$400 |
$400 |
$400 |
$400 |
$400 |
$400 |
$400 |
$400 |
$400 |
$400 |
|
|
Other |
$0 |
$0 |
$0 |
$0 |
$0 |
$0 |
$0 |
$0 |
$0 |
$0 |
$0 |
$0 |
|
|
Subtotal Direct Cost of Sales |
$400 |
$400 |
$400 |
$400 |
$400 |
$400 |
$400 |
$400 |
$400 |
$400 |
$400 |
$400 |
|
|
Personnel Plan |
|||||||||||||
|
Month 1 |
Month 2 |
Month 3 |
Month 4 |
Month 5 |
Month 6 |
Month 7 |
Month 8 |
Month 9 |
Month 10 |
Month 11 |
Month 12 |
||
|
Michael Morisson |
0% |
$2,500 |
$2,500 |
$2,500 |
$2,500 |
$2,500 |
$2,500 |
$2,500 |
$2,500 |
$2,500 |
$2,500 |
$2,500 |
$2,500 |
|
Other |
0% |
$1,500 |
$1,500 |
$1,500 |
$1,500 |
$1,500 |
$1,500 |
$1,500 |
$1,500 |
$1,500 |
$1,500 |
$1,500 |
$1,500 |
|
Total People |
2 |
2 |
2 |
2 |
2 |
2 |
2 |
2 |
2 |
2 |
2 |
2 |
|
|
Total Payroll |
$4,000 |
$4,000 |
$4,000 |
$4,000 |
$4,000 |
$4,000 |
$4,000 |
$4,000 |
$4,000 |
$4,000 |
$4,000 |
$4,000 |
|
|
General Assumptions |
|||||||||||||
|
Month 1 |
Month 2 |
Month 3 |
Month 4 |
Month 5 |
Month 6 |
Month 7 |
Month 8 |
Month 9 |
Month 10 |
Month 11 |
Month 12 |
||
|
Plan Month |
1 |
2 |
3 |
4 |
5 |
6 |
7 |
8 |
9 |
10 |
11 |
12 |
|
|
Current Interest Rate |
10.00% |
10.00% |
10.00% |
10.00% |
10.00% |
10.00% |
10.00% |
10.00% |
10.00% |
10.00% |
10.00% |
10.00% |
|
|
Long-term Interest Rate |
10.00% |
10.00% |
10.00% |
10.00% |
10.00% |
10.00% |
10.00% |
10.00% |
10.00% |
10.00% |
10.00% |
10.00% |
|
|
Tax Rate |
30.00% |
25.00% |
25.00% |
25.00% |
25.00% |
25.00% |
25.00% |
25.00% |
25.00% |
25.00% |
25.00% |
25.00% |
|
|
Other |
0 |
0 |
0 |
0 |
0 |
0 |
0 |
0 |
0 |
0 |
0 |
0 |
|
|
Pro Forma Profit and Loss |
|||||||||||||
|
Month 1 |
Month 2 |
Month 3 |
Month 4 |
Month 5 |
Month 6 |
Month 7 |
Month 8 |
Month 9 |
Month 10 |
Month 11 |
Month 12 |
||
|
Sales |
$5,000 |
$7,000 |
$12,000 |
$13,000 |
$13,000 |
$13,000 |
$14,000 |
$14,000 |
$14,000 |
$15,000 |
$15,000 |
$14,000 |
|
|
Direct Cost of Sales |
$400 |
$400 |
$400 |
$400 |
$400 |
$400 |
$400 |
$400 |
$400 |
$400 |
$400 |
$400 |
|
|
Other |
$0 |
$0 |
$0 |
$0 |
$0 |
$0 |
$0 |
$0 |
$0 |
$0 |
$0 |
$0 |
|
|
Total Cost of Sales |
$400 |
$400 |
$400 |
$400 |
$400 |
$400 |
$400 |
$400 |
$400 |
$400 |
$400 |
$400 |
|
|
Gross Margin |
$4,600 |
$6,600 |
$11,600 |
$12,600 |
$12,600 |
$12,600 |
$13,600 |
$13,600 |
$13,600 |
$14,600 |
$14,600 |
$13,600 |
|
|
Gross Margin % |
92.00% |
94.29% |
96.67% |
96.92% |
96.92% |
96.92% |
97.14% |
97.14% |
97.14% |
97.33% |
97.33% |
97.14% |
|
|
Expenses |
|||||||||||||
|
Payroll |
$4,000 |
$4,000 |
$4,000 |
$4,000 |
$4,000 |
$4,000 |
$4,000 |
$4,000 |
$4,000 |
$4,000 |
$4,000 |
$4,000 |
|
|
Sales and Marketing and Other Expenses |
$1,300 |
$1,300 |
$1,600 |
$1,600 |
$1,600 |
$1,600 |
$1,600 |
$1,600 |
$1,600 |
$1,600 |
$1,600 |
$1,600 |
|
|
Depreciation |
$2,000 |
$2,000 |
$2,000 |
$2,000 |
$2,000 |
$2,000 |
$2,000 |
$2,000 |
$2,000 |
$2,000 |
$2,000 |
$2,000 |
|
|
Gas |
$400 |
$400 |
$400 |
$400 |
$400 |
$400 |
$400 |
$400 |
$400 |
$400 |
$400 |
$400 |
|
|
Utilities & phone |
$200 |
$200 |
$200 |
$200 |
$200 |
$200 |
$200 |
$200 |
$200 |
$200 |
$200 |
$200 |
|
|
Rent |
$300 |
$300 |
$300 |
$300 |
$300 |
$300 |
$300 |
$300 |
$300 |
$300 |
$300 |
$300 |
|
|
Payroll Taxes |
15% |
$600 |
$600 |
$600 |
$600 |
$600 |
$600 |
$600 |
$600 |
$600 |
$600 |
$600 |
$600 |
|
Other |
$0 |
$0 |
$0 |
$0 |
$0 |
$0 |
$0 |
$0 |
$0 |
$0 |
$0 |
$0 |
|
|
Total Operating Expenses |
$8,800 |
$8,800 |
$9,100 |
$9,100 |
$9,100 |
$9,100 |
$9,100 |
$9,100 |
$9,100 |
$9,100 |
$9,100 |
$9,100 |
|
|
Profit Before Interest and Taxes |
($4,200) |
($2,200) |
$2,500 |
$3,500 |
$3,500 |
$3,500 |
$4,500 |
$4,500 |
$4,500 |
$5,500 |
$5,500 |
$4,500 |
|
|
EBITDA |
($2,200) |
($200) |
$4,500 |
$5,500 |
$5,500 |
$5,500 |
$6,500 |
$6,500 |
$6,500 |
$7,500 |
$7,500 |
$6,500 |
|
|
Interest Expense |
$2,500 |
$2,500 |
$2,500 |
$2,500 |
$2,500 |
$2,500 |
$2,500 |
$2,500 |
$2,500 |
$2,500 |
$2,500 |
$2,500 |
|
|
Taxes Incurred |
($2,010) |
($1,175) |
$0 |
$250 |
$250 |
$250 |
$500 |
$500 |
$500 |
$750 |
$750 |
$500 |
|
|
Net Profit |
($4,690) |
($3,525) |
$0 |
$750 |
$750 |
$750 |
$1,500 |
$1,500 |
$1,500 |
$2,250 |
$2,250 |
$1,500 |
|
|
Net Profit/Sales |
-93.80% |
-50.36% |
0.00% |
5.77% |
5.77% |
5.77% |
10.71% |
10.71% |
10.71% |
15.00% |
15.00% |
10.71% |
|
|
Pro Forma Cash Flow |
|||||||||||||
|
Month 1 |
Month 2 |
Month 3 |
Month 4 |
Month 5 |
Month 6 |
Month 7 |
Month 8 |
Month 9 |
Month 10 |
Month 11 |
Month 12 |
||
|
Cash Received |
|||||||||||||
|
Cash from Operations |
|||||||||||||
|
Cash Sales |
$1,250 |
$1,750 |
$3,000 |
$3,250 |
$3,250 |
$3,250 |
$3,500 |
$3,500 |
$3,500 |
$3,750 |
$3,750 |
$3,500 |
|
|
Cash from Receivables |
$0 |
$125 |
$3,800 |
$5,375 |
$9,025 |
$9,750 |
$9,750 |
$9,775 |
$10,500 |
$10,500 |
$10,525 |
$11,250 |
|
|
Subtotal Cash from Operations |
$1,250 |
$1,875 |
$6,800 |
$8,625 |
$12,275 |
$13,000 |
$13,250 |
$13,275 |
$14,000 |
$14,250 |
$14,275 |
$14,750 |
|
|
Additional Cash Received |
|||||||||||||
|
Sales Tax, VAT, HST/GST Received |
0.00% |
$0 |
$0 |
$0 |
$0 |
$0 |
$0 |
$0 |
$0 |
$0 |
$0 |
$0 |
$0 |
|
New Current Borrowing |
$0 |
$0 |
$0 |
$0 |
$0 |
$0 |
$0 |
$0 |
$0 |
$0 |
$0 |
$0 |
|
|
New Other Liabilities (interest-free) |
$0 |
$0 |
$0 |
$0 |
$0 |
$0 |
$0 |
$0 |
$0 |
$0 |
$0 |
$0 |
|
|
New Long-term Liabilities |
$0 |
$0 |
$0 |
$0 |
$0 |
$0 |
$0 |
$0 |
$0 |
$0 |
$0 |
$0 |
|
|
Sales of Other Current Assets |
$0 |
$0 |
$0 |
$0 |
$0 |
$0 |
$0 |
$0 |
$0 |
$0 |
$0 |
$0 |
|
|
Sales of Long-term Assets |
$0 |
$0 |
$0 |
$0 |
$0 |
$0 |
$0 |
$0 |
$0 |
$0 |
$0 |
$0 |
|
|
New Investment Received |
$0 |
$0 |
$0 |
$0 |
$0 |
$0 |
$0 |
$0 |
$0 |
$0 |
$0 |
$0 |
|
|
Subtotal Cash Received |
$1,250 |
$1,875 |
$6,800 |
$8,625 |
$12,275 |
$13,000 |
$13,250 |
$13,275 |
$14,000 |
$14,250 |
$14,275 |
$14,750 |
|
|
Expenditures |
Month 1 |
Month 2 |
Month 3 |
Month 4 |
Month 5 |
Month 6 |
Month 7 |
Month 8 |
Month 9 |
Month 10 |
Month 11 |
Month 12 |
|
|
Expenditures from Operations |
|||||||||||||
|
Cash Spending |
$4,000 |
$4,000 |
$4,000 |
$4,000 |
$4,000 |
$4,000 |
$4,000 |
$4,000 |
$4,000 |
$4,000 |
$4,000 |
$4,000 |
|
|
Bill Payments |
$110 |
$3,318 |
$4,174 |
$5,642 |
$6,817 |
$5,850 |
$5,892 |
$7,067 |
$6,133 |
$7,075 |
$6,350 |
$6,375 |
|
|
Subtotal Spent on Operations |
$4,110 |
$7,318 |
$8,174 |
$9,642 |
$10,817 |
$9,850 |
$9,892 |
$11,067 |
$10,133 |
$11,075 |
$10,350 |
$10,375 |
|
|
Additional Cash Spent |
|||||||||||||
|
Sales Tax, VAT, HST/GST Paid Out |
$0 |
$0 |
$0 |
$0 |
$0 |
$0 |
$0 |
$0 |
$0 |
$0 |
$0 |
$0 |
|
|
Principal Repayment of Current Borrowing |
$0 |
$0 |
$0 |
$0 |
$0 |
$0 |
$0 |
$0 |
$0 |
$0 |
$0 |
$0 |
|
|
Other Liabilities Principal Repayment |
$0 |
$0 |
$0 |
$0 |
$0 |
$0 |
$0 |
$0 |
$0 |
$0 |
$0 |
$0 |
|
|
Long-term Liabilities Principal Repayment |
$0 |
$0 |
$0 |
$0 |
$0 |
$0 |
$0 |
$0 |
$0 |
$0 |
$0 |
$0 |
|
|
Purchase Other Current Assets |
$0 |
$0 |
$0 |
$0 |
$0 |
$0 |
$0 |
$0 |
$0 |
$0 |
$0 |
$0 |
|
|
Purchase Long-term Assets |
$0 |
$0 |
$0 |
$0 |
$0 |
$0 |
$0 |
$0 |
$0 |
$0 |
$0 |
$0 |
|
|
Dividends |
$0 |
$0 |
$0 |
$0 |
$0 |
$0 |
$0 |
$0 |
$0 |
$0 |
$0 |
$0 |
|
|
Subtotal Cash Spent |
$4,110 |
$7,318 |
$8,174 |
$9,642 |
$10,817 |
$9,850 |
$9,892 |
$11,067 |
$10,133 |
$11,075 |
$10,350 |
$10,375 |
|
|
Net Cash Flow |
($2,860) |
($5,443) |
($1,374) |
($1,017) |
$1,458 |
$3,150 |
$3,358 |
$2,208 |
$3,867 |
$3,175 |
$3,925 |
$4,375 |
|
|
Cash Balance |
$57,140 |
$51,698 |
$50,323 |
$49,307 |
$50,765 |
$53,915 |
$57,273 |
$59,482 |
$63,348 |
$66,523 |
$70,448 |
$74,823 |
|
|
Pro Forma Balance Sheet |
|||||||||||||
|
Month 1 |
Month 2 |
Month 3 |
Month 4 |
Month 5 |
Month 6 |
Month 7 |
Month 8 |
Month 9 |
Month 10 |
Month 11 |
Month 12 |
||
|
Assets |
Starting Balances |
||||||||||||
|
Current Assets |
|||||||||||||
|
Cash |
$60,000 |
$57,140 |
$51,698 |
$50,323 |
$49,307 |
$50,765 |
$53,915 |
$57,273 |
$59,482 |
$63,348 |
$66,523 |
$70,448 |
$74,823 |
|
Accounts Receivable |
$0 |
$3,750 |
$8,875 |
$14,075 |
$18,450 |
$19,175 |
$19,175 |
$19,925 |
$20,650 |
$20,650 |
$21,400 |
$22,125 |
$21,375 |
|
Inventory |
$2,000 |
$1,600 |
$1,200 |
$800 |
$1,400 |
$1,000 |
$600 |
$1,200 |
$800 |
$1,400 |
$1,000 |
$600 |
$1,200 |
|
Other Current Assets |
$0 |
$0 |
$0 |
$0 |
$0 |
$0 |
$0 |
$0 |
$0 |
$0 |
$0 |
$0 |
$0 |
|
Total Current Assets |
$62,000 |
$62,490 |
$61,773 |
$65,198 |
$69,157 |
$70,940 |
$73,690 |
$78,398 |
$80,932 |
$85,398 |
$88,923 |
$93,173 |
$97,398 |
|
Long-term Assets |
|||||||||||||
|
Long-term Assets |
$240,000 |
$240,000 |
$240,000 |
$240,000 |
$240,000 |
$240,000 |
$240,000 |
$240,000 |
$240,000 |
$240,000 |
$240,000 |
$240,000 |
$240,000 |
|
Accumulated Depreciation |
$0 |
$2,000 |
$4,000 |
$6,000 |
$8,000 |
$10,000 |
$12,000 |
$14,000 |
$16,000 |
$18,000 |
$20,000 |
$22,000 |
$24,000 |
|
Total Long-term Assets |
$240,000 |
$238,000 |
$236,000 |
$234,000 |
$232,000 |
$230,000 |
$228,000 |
$226,000 |
$224,000 |
$222,000 |
$220,000 |
$218,000 |
$216,000 |
|
Total Assets |
$302,000 |
$300,490 |
$297,773 |
$299,198 |
$301,157 |
$300,940 |
$301,690 |
$304,398 |
$304,932 |
$307,398 |
$308,923 |
$311,173 |
$313,398 |
|
Liabilities and Capital |
Month 1 |
Month 2 |
Month 3 |
Month 4 |
Month 5 |
Month 6 |
Month 7 |
Month 8 |
Month 9 |
Month 10 |
Month 11 |
Month 12 |
|
|
Current Liabilities |
|||||||||||||
|
Accounts Payable |
$0 |
$3,180 |
$3,988 |
$5,413 |
$6,622 |
$5,655 |
$5,655 |
$6,863 |
$5,897 |
$6,863 |
$6,138 |
$6,138 |
$6,863 |
|
Current Borrowing |
$0 |
$0 |
$0 |
$0 |
$0 |
$0 |
$0 |
$0 |
$0 |
$0 |
$0 |
$0 |
$0 |
|
Other Current Liabilities |
$0 |
$0 |
$0 |
$0 |
$0 |
$0 |
$0 |
$0 |
$0 |
$0 |
$0 |
$0 |
$0 |
|
Subtotal Current Liabilities |
$0 |
$3,180 |
$3,988 |
$5,413 |
$6,622 |
$5,655 |
$5,655 |
$6,863 |
$5,897 |
$6,863 |
$6,138 |
$6,138 |
$6,863 |
|
Long-term Liabilities |
$300,000 |
$300,000 |
$300,000 |
$300,000 |
$300,000 |
$300,000 |
$300,000 |
$300,000 |
$300,000 |
$300,000 |
$300,000 |
$300,000 |
$300,000 |
|
Total Liabilities |
$300,000 |
$303,180 |
$303,988 |
$305,413 |
$306,622 |
$305,655 |
$305,655 |
$306,863 |
$305,897 |
$306,863 |
$306,138 |
$306,138 |
$306,863 |
|
Paid-in Capital |
$17,000 |
$17,000 |
$17,000 |
$17,000 |
$17,000 |
$17,000 |
$17,000 |
$17,000 |
$17,000 |
$17,000 |
$17,000 |
$17,000 |
$17,000 |
|
Retained Earnings |
($15,000) |
($15,000) |
($15,000) |
($15,000) |
($15,000) |
($15,000) |
($15,000) |
($15,000) |
($15,000) |
($15,000) |
($15,000) |
($15,000) |
($15,000) |
|
Earnings |
$0 |
($4,690) |
($8,215) |
($8,215) |
($7,465) |
($6,715) |
($5,965) |
($4,465) |
($2,965) |
($1,465) |
$785 |
$3,035 |
$4,535 |
|
Total Capital |
$2,000 |
($2,690) |
($6,215) |
($6,215) |
($5,465) |
($4,715) |
($3,965) |
($2,465) |
($965) |
$535 |
$2,785 |
$5,035 |
$6,535 |
|
Total Liabilities and Capital |
$302,000 |
$300,490 |
$297,773 |
$299,198 |
$301,157 |
$300,940 |
$301,690 |
$304,398 |
$304,932 |
$307,398 |
$308,923 |
$311,173 |
$313,398 |
|
Net Worth |
$2,000 |
($2,690) |
($6,215) |
($6,215) |
($5,465) |
($4,715) |
($3,965) |
($2,465) |
($965) |
$535 |
$2,785 |
$5,035 |
$6,535 |