Art Packaging Installation Business Plan
The Art Sentry
Executive Summary
The Art Sentry is a professional art packager and installer serving both residential and corporate markets. Dan Klutz, the founder and owner is a 12 year industry veteran who, while working with the Portland Art Museum, designed a new and innovative packaging system that has since been adopted by seven other national-class museums. Dan will be offering his skills to the Portland, OR art market.
Currently, the art packaging/installation market is relatively small. There are several generalists that perform similar work; however, their skill level is generally not adequate to ensure the safety of valuable art work. The skills necessary take time to develop, and Dan, who possesses these skills, currently leverages this experience as a competitive advantage.
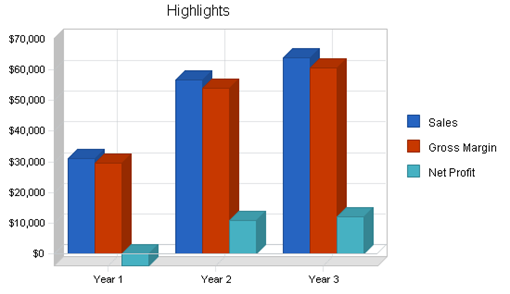
Through superior service and customer attention, Dan will steadily grow The Art Sentry's market share, generating $64,000 in revenue by the end of year three.
1.1 Objectives
The objectives for the first three years of operation include:
- To create a home-based business whose primary goal is to exceed customer's expectations.
- To increase the number of clients by 20% a year through superior performance and word-of-mouth referrals.
- To develop a sustainable home business, surviving off of its own cash flow.
1.2 Mission
The Art Sentry's mission is to provide the customer with professional packaging and hanging services for art work. We exist to attract and maintain customers. When we adhere to this maxim, everything else will fall into place. Our services will exceed the expectations of our customers.
1.3 Keys to Success
The key to success will be to provide customers with personal, professional attention and service.
Company Summary
The Art Sentry is a home-based service provider that specializes in packaging and installation of artwork. The owner, Dan Klutz, is an industry trained professional who is methodical in the handling of valuable art work. Dan has experience in many different mediums including paintings, sculptures, mobiles and ceramics. The Art Sentry will service both residential and commercial clients.
2.1 Company Ownership
The Art Sentry is a sole proprietorship founded and owned by Dan Klutz. It will be operated out of Dan's Portland, OR home.
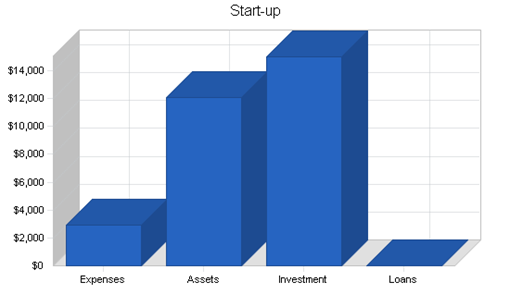
2.2 Start-up Summary
The Art Sentry will incur the following start-up costs:
- Computer system with a CD-RW, printer, Microsoft® Office and QuickBooks® Pro.
- Cordless power drill, hand crank drill, hammer, dolly, screw driver set, drill bit set, level, chalk and pencils.
- Foam, tape, cardboard, plastic, hooks, screws, screw eyes.
- Land line phone and cellular phone.
|
Start-up Requirements |
|
|
Start-up Expenses |
|
|
Legal |
$500 |
|
Stationery etc. |
$150 |
|
Assorted materials |
$100 |
|
Computer System |
$2,200 |
|
Other |
$0 |
|
Total Start-up Expenses |
$2,950 |
|
Start-up Assets |
|
|
Cash Required |
$12,050 |
|
Other Current Assets |
$0 |
|
Long-term Assets |
$0 |
|
Total Assets |
$12,050 |
|
Total Requirements |
$15,000 |
|
Start-up Funding |
|
|
Start-up Expenses to Fund |
$2,950 |
|
Start-up Assets to Fund |
$12,050 |
|
Total Funding Required |
$15,000 |
|
Assets |
|
|
Non-cash Assets from Start-up |
$0 |
|
Cash Requirements from Start-up |
$12,050 |
|
Additional Cash Raised |
$0 |
|
Cash Balance on Starting Date |
$12,050 |
|
Total Assets |
$12,050 |
|
Liabilities and Capital |
|
|
Liabilities |
|
|
Current Borrowing |
$0 |
|
Long-term Liabilities |
$0 |
|
Accounts Payable (Outstanding Bills) |
$0 |
|
Other Current Liabilities (interest-free) |
$0 |
|
Total Liabilities |
$0 |
|
Capital |
|
|
Planned Investment |
|
|
Dan |
$15,000 |
|
Investor 2 |
$0 |
|
Other |
$0 |
|
Additional Investment Requirement |
$0 |
|
Total Planned Investment |
$15,000 |
|
Loss at Start-up (Start-up Expenses) |
($2,950) |
|
Total Capital |
$12,050 |
|
Total Capital and Liabilities |
$12,050 |
|
Total Funding |
$15,000 |
Services
The Art Sentry provides both residential and commercial customers with art packaging and installation services. The packaging services will be useful for art that is going to be stored or shipped. The hanging services can be used if a new piece is going to be mounted in a home or business, or if an existing piece will have a new home within an existing room/structure.
The Art Sentry's professional skills were learned through 12 years of practical experience as a shipper, as well as a head installer/packer for a nationally recognized museum of art. The Art Sentry's services differ vastly from other shipping vendors, such as the Mail Boxes, etc.-type shipper or the handyman installer. Having the credentials of a packer is not sufficient to ensure zero damage in shipment. The packaging of art is a science in itself. Having a specialized art packager prepare the work for shipment is inexpensive insurance for the feeling of security that the item is well protected and likely to arrive at the destination undamaged. The Art Sentry is differentiated from the standard handyman that uses traditional wire to hang the works. Wire is a fundamentally flawed method of hanging pieces because of the inherent instability of the hanging method. The Art Sentry only uses hooks to mount pieces. The use of hooks eliminates the possibility of shifting of the object. The hooks take more time and precision to set up but are the only proper way of hanging art pieces of any value.
The Art Sentry charges clients either a flat project rate (that would be calculated after viewing the proposed requirements) or an hourly rate.
Market Analysis Summary
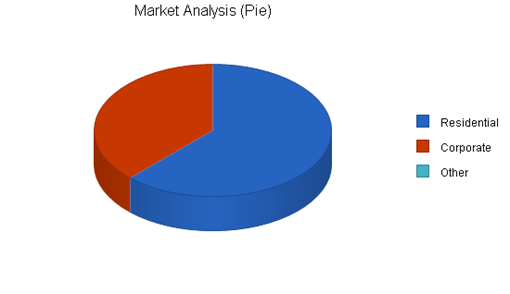
The market can be segmented into two different groups, residential customers and corporate clients, which are further described in the following sub-topics.
4.1 Market Segmentation
The market can be segmented into two different groups:
- Residential customers. This group would require The Art Sentry for packaging a piece of art that they are selling and must ship, or if they are moving the art work. The residential customers will also use the Sentry to have works hung in their home. The residential customers are often the preferred customer to work for because they are choosing The Art Sentry because they are concerned about protecting their art as much as possible. These customers are usually art collectors or investors who see the value in paying for extra care to protect their art work.
- Corporate customers. This group will utilize The Art Sentry for hanging services as well as packaging art work. The corporate customer may have less of a personal connection to the art pieces, but recognizes the importance of protecting the investment.
|
Market Analysis |
|||||||
|
Year 1 |
Year 2 |
Year 3 |
Year 4 |
Year 5 |
|||
|
Potential Customers |
Growth |
CAGR |
|||||
|
Residential |
8% |
10,767 |
11,628 |
12,558 |
13,563 |
14,648 |
8.00% |
|
Corporate |
7% |
6,545 |
7,003 |
7,493 |
8,018 |
8,579 |
7.00% |
|
Other |
0% |
0 |
0 |
0 |
0 |
0 |
0.00% |
|
Total |
7.62% |
17,312 |
18,631 |
20,051 |
21,581 |
23,227 |
7.62% |
4.2 Target Market Segment Strategy
The Art Sentry will not need to do much in terms of strategies for the two different target markets. Both segments will look for service providers in the same places, so there is no need to develop independent segmenting strategies.
4.3 Service Business Analysis
This market is a focused niche with few people that solely concentrate on this specialty. This industry is serviced by a few specialists, but most of the business activity is provided by generalist packagers that do not concentrate on art work. Analyzed from an industry perspective, the generalist is often not sufficiently qualified to be providing adequate art packaging services. If the prospective customer were to ask an independent gallery or an art museum for advice on how best to package and transport their art work, they will likely be told to avoid the generalists and look instead for a specialist to provide safety of their art work while it is being handled.
4.3.1 Competition and Buying Patterns
The competition can be broken down into several categories:
- Handymen: This group of competitors are often called to provide hanging services for art work. The type of people that use this service provider may not recognize the inherent insuperiority of this service provider. This might be explained by the fact that the value of the art is for appearance, instead of as a monetary investment, and so the desire to keep the costs down is an important factor in their decision.
- Shippers (such as Mail Boxes, etc.): These competitors do handle a fair amount of the packaging business. Their popularity is based on the perception that, because they are competent for packaging other objects, they are also qualified to handle art work. Art pieces are a very distinct type of cargo, with each type of art, whether a water color, painting, sculpture, or mobile requiring special attention and knowledge in the protection against harm during transport. This knowledge is gained through very specific work with art packaging, not general packaging techniques.
- Commercial shippers that also offer packaging services: This competitor services the niche of packaging art to a much smaller degree than the Mail Boxes, etc.-type companies and also possesses the same general perception and lack of proper knowledge needed to ensure safe transport.
- Galleries: Most galleries offer packaging and hanging as a value-added service to their customers. It is unusual for a gallery to provide these service for non-customers.
People, for a multitude of reasons, will choose these less-qualified packagers without understanding that the wrong service provider can do significant damage to a piece of art work.
Management Summary
Throughout Dan's childhood he was always good with his hands. He was constantly taking things apart and putting them back together. While in college, Dan worked part time with a shipper. Dan's responsibilities were to package delicate items for shipment. This was a challenge for Dan because packaging delicate items took skill to prevent any claim for damage during transport. Dan used his handiness to construct intricate packaging techniques for delicate items.
Upon graduation Dan worked at the art museum as the head of exhibit installation and packaging/transport. Dan was at the art museum for a total of nine years. While at the museum, Dan created a new system of packaging the art work which was far more protective and cost effective than the old system. This new system was so much of an improvement over the previous method that other museums across the company paid Dan to travel to their museum and give demonstrations to his technique. In the Fall of 2000 Dan decided that he was going to leave the museum and start his own company.
5.1 Personnel Plan
Dan will be The Art Sentry's only employee.
|
Personnel Plan |
|||
|
Year 1 |
Year 2 |
Year 3 |
|
|
Owner |
$30,000 |
$35,000 |
$40,000 |
|
Name or Title |
$0 |
$0 |
$0 |
|
Name or Title |
$0 |
$0 |
$0 |
|
Other |
$0 |
$0 |
$0 |
|
Total People |
0 |
0 |
0 |
|
Total Payroll |
$30,000 |
$35,000 |
$40,000 |
Competitive Edge
The Art Sentry's competitive edge is based on the extensive skill and industry knowledge that Dan possesses. This is very specific knowledge that few people have. This skill set allows The Art Sentry to provide superior services relative to the other service providers.
6.1 Marketing Strategy
The marketing goal will be to raise visibility and awareness of The Art Sentry with the prospective target segments. The Art Sentry will use a Yellow Pages ad as people turn to them when they are looking for a listing of different service providers.
Another marketing strategy will be word-of-mouth referral. Initially this will be started through networking efforts based on personal relationships that Dan has formed at the Portland Art Museum and local small galleries. Once the Museum begins to refer prospective clients to Dan, business will grow as those initial customers will also begin to make referrals. Art aficionados are not a huge group of the population but it is reasonable to presume that people that collect art have similar minded friends that also collect art.
These grass root efforts of word of mouth referrals will take a bit of time to develop, but will provide The Art Sentry with a sufficient flow of customers.
6.2 Sales Strategy
The sales strategy will be be based on communicating The Art Sentry's competitive edge of professional experience that is generally unmatched in the industry. This high level of experience will be more than sufficient to turn the prospective customer/ information seeker into a long term customer and cheerleader for The Art Sentry.
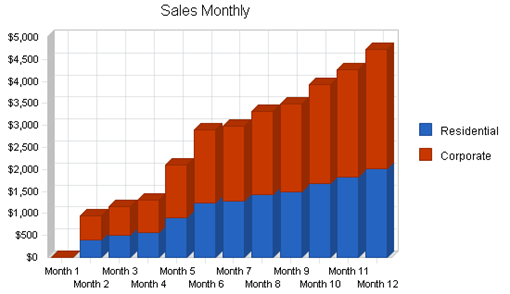
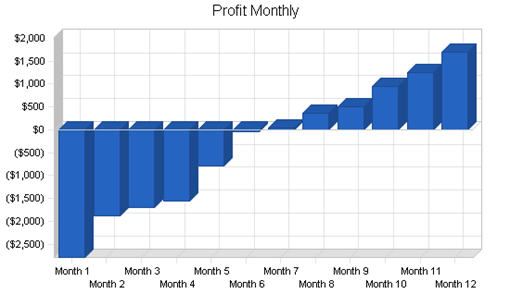
6.2.1 Sales Forecast
The sales for the first several months will be slow. It is expected that it will take some time to build up sufficient business, especially in light of the fact that The Art Sentry is using primarily grass root methods of marketing. Business will begin to reach decent sales activity by month five, and grow steadily after that. Profitability is forecasted to occur fairly quickly, but is a function of the fact that the overhead is low, as The Art Sentry is a home-based business. Revenues will reach $64,000 by the end of year three.
|
Sales Forecast |
|||
|
Year 1 |
Year 2 |
Year 3 |
|
|
Sales |
|||
|
Residential |
$13,325 |
$24,300 |
$27,407 |
|
Corporate |
$17,767 |
$32,400 |
$36,543 |
|
Total Sales |
$31,092 |
$56,700 |
$63,950 |
|
Direct Cost of Sales |
Year 1 |
Year 2 |
Year 3 |
|
Residential |
$666 |
$1,215 |
$1,370 |
|
Corporate |
$888 |
$1,620 |
$1,827 |
|
Subtotal Direct Cost of Sales |
$1,555 |
$2,835 |
$3,198 |
6.3 Milestones
The Art Sentry will have several milestones early on:
- Business plan completion. This will be an indispensable tool for the ongoing performance and improvement of the company.
- Office set and equipment acquisition.
- Reaching profitability.
|
Milestones |
|||||
|
Milestone |
Start Date |
End Date |
Budget |
Manager |
Department |
|
Business plan completion |
1/1/2001 |
2/1/2001 |
$0 |
ABC |
Marketing |
|
Office set up and equipment acquisition |
1/1/2001 |
2/1/2001 |
$0 |
ABC |
Department |
|
Profitability |
1/1/2001 |
9/31/01 |
$0 |
ABC |
Department |
|
Totals |
$0 |
||||
Financial Plan
The following sections will outline important financial information.
7.1 Important Assumptions
The following table details important financial assumptions.
|
General Assumptions |
|||
|
Year 1 |
Year 2 |
Year 3 |
|
|
Plan Month |
1 |
2 |
3 |
|
Current Interest Rate |
10.00% |
10.00% |
10.00% |
|
Long-term Interest Rate |
10.00% |
10.00% |
10.00% |
|
Tax Rate |
30.00% |
30.00% |
30.00% |
|
Other |
0 |
0 |
0 |
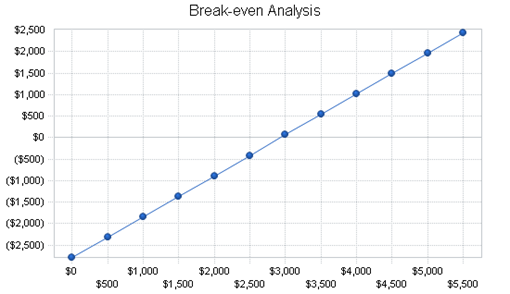
7.2 Break-even Analysis
The Break-even Analysis indicates that approximately $3,400 will be needed in monthly revenue to reach the break-even point.
|
Break-even Analysis |
|
|
Monthly Revenue Break-even |
$2,936 |
|
Assumptions: |
|
|
Average Percent Variable Cost |
5% |
|
Estimated Monthly Fixed Cost |
$2,789 |
7.3 Projected Profit and Loss
The following table will indicate projected profit and loss.
|
Pro Forma Profit and Loss |
|||
|
Year 1 |
Year 2 |
Year 3 |
|
|
Sales |
$31,092 |
$56,700 |
$63,950 |
|
Direct Cost of Sales |
$1,555 |
$2,835 |
$3,198 |
|
Other Production Expenses |
$0 |
$0 |
$0 |
|
Total Cost of Sales |
$1,555 |
$2,835 |
$3,198 |
|
Gross Margin |
$29,538 |
$53,865 |
$60,753 |
|
Gross Margin % |
95.00% |
95.00% |
95.00% |
|
Expenses |
|||
|
Payroll |
$30,000 |
$35,000 |
$40,000 |
|
Sales and Marketing and Other Expenses |
$1,200 |
$1,200 |
$1,200 |
|
Depreciation |
$468 |
$468 |
$468 |
|
Leased Equipment |
$0 |
$0 |
$0 |
|
Licenses and Bonding |
$600 |
$600 |
$600 |
|
Insurance |
$1,200 |
$1,200 |
$1,200 |
|
Rent |
$0 |
$0 |
$0 |
|
Payroll Taxes |
$0 |
$0 |
$0 |
|
Other |
$0 |
$0 |
$0 |
|
Total Operating Expenses |
$33,468 |
$38,468 |
$43,468 |
|
Profit Before Interest and Taxes |
($3,930) |
$15,397 |
$17,285 |
|
EBITDA |
($3,462) |
$15,865 |
$17,753 |
|
Interest Expense |
$0 |
$0 |
$0 |
|
Taxes Incurred |
$0 |
$4,619 |
$5,185 |
|
Net Profit |
($3,930) |
$10,778 |
$12,099 |
|
Net Profit/Sales |
-12.64% |
19.01% |
18.92% |
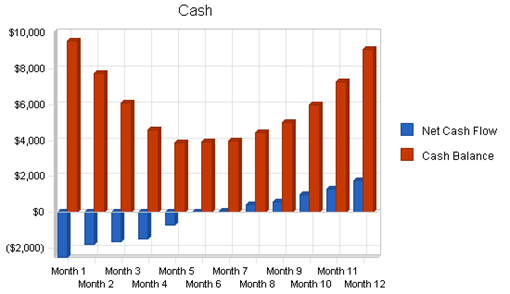
7.4 Projected Cash Flow
The following chart and table will indicate projected cash flow.
|
Pro Forma Cash Flow |
|||
|
Year 1 |
Year 2 |
Year 3 |
|
|
Cash Received |
|||
|
Cash from Operations |
|||
|
Cash Sales |
$31,092 |
$56,700 |
$63,950 |
|
Subtotal Cash from Operations |
$31,092 |
$56,700 |
$63,950 |
|
Additional Cash Received |
|||
|
Sales Tax, VAT, HST/GST Received |
$0 |
$0 |
$0 |
|
New Current Borrowing |
$0 |
$0 |
$0 |
|
New Other Liabilities (interest-free) |
$0 |
$0 |
$0 |
|
New Long-term Liabilities |
$0 |
$0 |
$0 |
|
Sales of Other Current Assets |
$0 |
$0 |
$0 |
|
Sales of Long-term Assets |
$0 |
$0 |
$0 |
|
New Investment Received |
$0 |
$0 |
$0 |
|
Subtotal Cash Received |
$31,092 |
$56,700 |
$63,950 |
|
Expenditures |
Year 1 |
Year 2 |
Year 3 |
|
Expenditures from Operations |
|||
|
Cash Spending |
$30,000 |
$35,000 |
$40,000 |
|
Bill Payments |
$4,085 |
$10,065 |
$11,307 |
|
Subtotal Spent on Operations |
$34,085 |
$45,065 |
$51,307 |
|
Additional Cash Spent |
|||
|
Sales Tax, VAT, HST/GST Paid Out |
$0 |
$0 |
$0 |
|
Principal Repayment of Current Borrowing |
$0 |
$0 |
$0 |
|
Other Liabilities Principal Repayment |
$0 |
$0 |
$0 |
|
Long-term Liabilities Principal Repayment |
$0 |
$0 |
$0 |
|
Purchase Other Current Assets |
$0 |
$0 |
$0 |
|
Purchase Long-term Assets |
$0 |
$0 |
$0 |
|
Dividends |
$0 |
$0 |
$0 |
|
Subtotal Cash Spent |
$34,085 |
$45,065 |
$51,307 |
|
Net Cash Flow |
($2,992) |
$11,635 |
$12,644 |
|
Cash Balance |
$9,058 |
$20,693 |
$33,336 |
7.5 Projected Balance Sheet
The following table will indicate the projected balance sheet.
|
Pro Forma Balance Sheet |
|||
|
Year 1 |
Year 2 |
Year 3 |
|
|
Assets |
|||
|
Current Assets |
|||
|
Cash |
$9,058 |
$20,693 |
$33,336 |
|
Other Current Assets |
$0 |
$0 |
$0 |
|
Total Current Assets |
$9,058 |
$20,693 |
$33,336 |
|
Long-term Assets |
|||
|
Long-term Assets |
$0 |
$0 |
$0 |
|
Accumulated Depreciation |
$468 |
$936 |
$1,404 |
|
Total Long-term Assets |
($468) |
($936) |
($1,404) |
|
Total Assets |
$8,590 |
$19,757 |
$31,932 |
|
Liabilities and Capital |
Year 1 |
Year 2 |
Year 3 |
|
Current Liabilities |
|||
|
Accounts Payable |
$470 |
$859 |
$936 |
|
Current Borrowing |
$0 |
$0 |
$0 |
|
Other Current Liabilities |
$0 |
$0 |
$0 |
|
Subtotal Current Liabilities |
$470 |
$859 |
$936 |
|
Long-term Liabilities |
$0 |
$0 |
$0 |
|
Total Liabilities |
$470 |
$859 |
$936 |
|
Paid-in Capital |
$15,000 |
$15,000 |
$15,000 |
|
Retained Earnings |
($2,950) |
($6,880) |
$3,898 |
|
Earnings |
($3,930) |
$10,778 |
$12,099 |
|
Total Capital |
$8,120 |
$18,898 |
$30,997 |
|
Total Liabilities and Capital |
$8,590 |
$19,757 |
$31,932 |
|
Net Worth |
$8,120 |
$18,898 |
$30,997 |
7.6 Business Ratios
The following Ratios table compares our planned estimates with Standard Industry Code #7299
|
Ratio Analysis |
||||
|
Year 1 |
Year 2 |
Year 3 |
Industry Profile |
|
|
Sales Growth |
0.00% |
82.36% |
12.79% |
7.99% |
|
Percent of Total Assets |
||||
|
Other Current Assets |
0.00% |
0.00% |
0.00% |
44.22% |
|
Total Current Assets |
105.45% |
104.74% |
104.40% |
72.16% |
|
Long-term Assets |
-5.45% |
-4.74% |
-4.40% |
27.84% |
|
Total Assets |
100.00% |
100.00% |
100.00% |
100.00% |
|
Current Liabilities |
5.47% |
4.35% |
2.93% |
31.22% |
|
Long-term Liabilities |
0.00% |
0.00% |
0.00% |
11.80% |
|
Total Liabilities |
5.47% |
4.35% |
2.93% |
43.02% |
|
Net Worth |
94.53% |
95.65% |
97.07% |
56.98% |
|
Percent of Sales |
||||
|
Sales |
100.00% |
100.00% |
100.00% |
100.00% |
|
Gross Margin |
95.00% |
95.00% |
95.00% |
14.44% |
|
Selling, General & Administrative Expenses |
110.86% |
79.70% |
76.08% |
7.72% |
|
Advertising Expenses |
0.00% |
0.00% |
0.00% |
0.37% |
|
Profit Before Interest and Taxes |
-12.64% |
27.16% |
27.03% |
1.12% |
|
Main Ratios |
||||
|
Current |
19.27 |
24.08 |
35.63 |
1.68 |
|
Quick |
19.27 |
24.08 |
35.63 |
1.40 |
|
Total Debt to Total Assets |
5.47% |
4.35% |
2.93% |
57.54% |
|
Pre-tax Return on Net Worth |
-48.41% |
81.48% |
55.76% |
3.81% |
|
Pre-tax Return on Assets |
-45.76% |
77.93% |
54.13% |
8.97% |
|
Additional Ratios |
Year 1 |
Year 2 |
Year 3 |
|
|
Net Profit Margin |
-12.64% |
19.01% |
18.92% |
n.a |
|
Return on Equity |
-48.41% |
57.03% |
39.03% |
n.a |
|
Activity Ratios |
||||
|
Accounts Payable Turnover |
9.69 |
12.17 |
12.17 |
n.a |
|
Payment Days |
27 |
23 |
29 |
n.a |
|
Total Asset Turnover |
3.62 |
2.87 |
2.00 |
n.a |
|
Debt Ratios |
||||
|
Debt to Net Worth |
0.06 |
0.05 |
0.03 |
n.a |
|
Current Liab. to Liab. |
1.00 |
1.00 |
1.00 |
n.a |
|
Liquidity Ratios |
||||
|
Net Working Capital |
$8,588 |
$19,834 |
$32,401 |
n.a |
|
Interest Coverage |
0.00 |
0.00 |
0.00 |
n.a |
|
Additional Ratios |
||||
|
Assets to Sales |
0.28 |
0.35 |
0.50 |
n.a |
|
Current Debt/Total Assets |
5% |
4% |
3% |
n.a |
|
Acid Test |
19.27 |
24.08 |
35.63 |
n.a |
|
Sales/Net Worth |
3.83 |
3.00 |
2.06 |
n.a |
|
Dividend Payout |
0.00 |
0.00 |
0.00 |
n.a |
Appendix
|
Sales Forecast |
|||||||||||||
|
Month 1 |
Month 2 |
Month 3 |
Month 4 |
Month 5 |
Month 6 |
Month 7 |
Month 8 |
Month 9 |
Month 10 |
Month 11 |
Month 12 |
||
|
Sales |
|||||||||||||
|
Residential |
0% |
$0 |
$410 |
$495 |
$559 |
$900 |
$1,241 |
$1,276 |
$1,423 |
$1,490 |
$1,684 |
$1,824 |
$2,025 |
|
Corporate |
0% |
$0 |
$546 |
$660 |
$745 |
$1,200 |
$1,654 |
$1,701 |
$1,897 |
$1,987 |
$2,245 |
$2,432 |
$2,700 |
|
Total Sales |
$0 |
$956 |
$1,155 |
$1,304 |
$2,100 |
$2,895 |
$2,977 |
$3,320 |
$3,477 |
$3,929 |
$4,256 |
$4,725 |
|
|
Direct Cost of Sales |
Month 1 |
Month 2 |
Month 3 |
Month 4 |
Month 5 |
Month 6 |
Month 7 |
Month 8 |
Month 9 |
Month 10 |
Month 11 |
Month 12 |
|
|
Residential |
$0 |
$20 |
$25 |
$28 |
$45 |
$62 |
$64 |
$71 |
$75 |
$84 |
$91 |
$101 |
|
|
Corporate |
$0 |
$27 |
$33 |
$37 |
$60 |
$83 |
$85 |
$95 |
$99 |
$112 |
$122 |
$135 |
|
|
Subtotal Direct Cost of Sales |
$0 |
$48 |
$58 |
$65 |
$105 |
$145 |
$149 |
$166 |
$174 |
$196 |
$213 |
$236 |
|
|
Personnel Plan |
|||||||||||||
|
Month 1 |
Month 2 |
Month 3 |
Month 4 |
Month 5 |
Month 6 |
Month 7 |
Month 8 |
Month 9 |
Month 10 |
Month 11 |
Month 12 |
||
|
Owner |
0% |
$2,500 |
$2,500 |
$2,500 |
$2,500 |
$2,500 |
$2,500 |
$2,500 |
$2,500 |
$2,500 |
$2,500 |
$2,500 |
$2,500 |
|
Name or Title |
0% |
$0 |
$0 |
$0 |
$0 |
$0 |
$0 |
$0 |
$0 |
$0 |
$0 |
$0 |
$0 |
|
Name or Title |
0% |
$0 |
$0 |
$0 |
$0 |
$0 |
$0 |
$0 |
$0 |
$0 |
$0 |
$0 |
$0 |
|
Other |
0% |
$0 |
$0 |
$0 |
$0 |
$0 |
$0 |
$0 |
$0 |
$0 |
$0 |
$0 |
$0 |
|
Total People |
0 |
0 |
0 |
0 |
0 |
0 |
0 |
0 |
0 |
0 |
0 |
0 |
|
|
Total Payroll |
$2,500 |
$2,500 |
$2,500 |
$2,500 |
$2,500 |
$2,500 |
$2,500 |
$2,500 |
$2,500 |
$2,500 |
$2,500 |
$2,500 |
|
|
General Assumptions |
|||||||||||||
|
Month 1 |
Month 2 |
Month 3 |
Month 4 |
Month 5 |
Month 6 |
Month 7 |
Month 8 |
Month 9 |
Month 10 |
Month 11 |
Month 12 |
||
|
Plan Month |
1 |
2 |
3 |
4 |
5 |
6 |
7 |
8 |
9 |
10 |
11 |
12 |
|
|
Current Interest Rate |
10.00% |
10.00% |
10.00% |
10.00% |
10.00% |
10.00% |
10.00% |
10.00% |
10.00% |
10.00% |
10.00% |
10.00% |
|
|
Long-term Interest Rate |
10.00% |
10.00% |
10.00% |
10.00% |
10.00% |
10.00% |
10.00% |
10.00% |
10.00% |
10.00% |
10.00% |
10.00% |
|
|
Tax Rate |
30.00% |
30.00% |
30.00% |
30.00% |
30.00% |
30.00% |
30.00% |
30.00% |
30.00% |
30.00% |
30.00% |
30.00% |
|
|
Other |
0 |
0 |
0 |
0 |
0 |
0 |
0 |
0 |
0 |
0 |
0 |
0 |
|
|
Pro Forma Profit and Loss |
|||||||||||||
|
Month 1 |
Month 2 |
Month 3 |
Month 4 |
Month 5 |
Month 6 |
Month 7 |
Month 8 |
Month 9 |
Month 10 |
Month 11 |
Month 12 |
||
|
Sales |
$0 |
$956 |
$1,155 |
$1,304 |
$2,100 |
$2,895 |
$2,977 |
$3,320 |
$3,477 |
$3,929 |
$4,256 |
$4,725 |
|
|
Direct Cost of Sales |
$0 |
$48 |
$58 |
$65 |
$105 |
$145 |
$149 |
$166 |
$174 |
$196 |
$213 |
$236 |
|
|
Other Production Expenses |
$0 |
$0 |
$0 |
$0 |
$0 |
$0 |
$0 |
$0 |
$0 |
$0 |
$0 |
$0 |
|
|
Total Cost of Sales |
$0 |
$48 |
$58 |
$65 |
$105 |
$145 |
$149 |
$166 |
$174 |
$196 |
$213 |
$236 |
|
|
Gross Margin |
$0 |
$908 |
$1,097 |
$1,239 |
$1,995 |
$2,750 |
$2,828 |
$3,154 |
$3,303 |
$3,732 |
$4,043 |
$4,489 |
|
|
Gross Margin % |
0.00% |
95.00% |
95.00% |
95.00% |
95.00% |
95.00% |
95.00% |
95.00% |
95.00% |
95.00% |
95.00% |
95.00% |
|
|
Expenses |
|||||||||||||
|
Payroll |
$2,500 |
$2,500 |
$2,500 |
$2,500 |
$2,500 |
$2,500 |
$2,500 |
$2,500 |
$2,500 |
$2,500 |
$2,500 |
$2,500 |
|
|
Sales and Marketing and Other Expenses |
$100 |
$100 |
$100 |
$100 |
$100 |
$100 |
$100 |
$100 |
$100 |
$100 |
$100 |
$100 |
|
|
Depreciation |
$39 |
$39 |
$39 |
$39 |
$39 |
$39 |
$39 |
$39 |
$39 |
$39 |
$39 |
$39 |
|
|
Leased Equipment |
$0 |
$0 |
$0 |
$0 |
$0 |
$0 |
$0 |
$0 |
$0 |
$0 |
$0 |
$0 |
|
|
Licenses and Bonding |
$50 |
$50 |
$50 |
$50 |
$50 |
$50 |
$50 |
$50 |
$50 |
$50 |
$50 |
$50 |
|
|
Insurance |
$100 |
$100 |
$100 |
$100 |
$100 |
$100 |
$100 |
$100 |
$100 |
$100 |
$100 |
$100 |
|
|
Rent |
$0 |
$0 |
$0 |
$0 |
$0 |
$0 |
$0 |
$0 |
$0 |
$0 |
$0 |
$0 |
|
|
Payroll Taxes |
15% |
$0 |
$0 |
$0 |
$0 |
$0 |
$0 |
$0 |
$0 |
$0 |
$0 |
$0 |
$0 |
|
Other |
$0 |
$0 |
$0 |
$0 |
$0 |
$0 |
$0 |
$0 |
$0 |
$0 |
$0 |
$0 |
|
|
Total Operating Expenses |
$2,789 |
$2,789 |
$2,789 |
$2,789 |
$2,789 |
$2,789 |
$2,789 |
$2,789 |
$2,789 |
$2,789 |
$2,789 |
$2,789 |
|
|
Profit Before Interest and Taxes |
($2,789) |
($1,881) |
($1,692) |
($1,550) |
($794) |
($39) |
$39 |
$365 |
$514 |
$943 |
$1,254 |
$1,700 |
|
|
EBITDA |
($2,750) |
($1,842) |
($1,653) |
($1,511) |
($755) |
($0) |
$78 |
$404 |
$553 |
$982 |
$1,293 |
$1,739 |
|
|
Interest Expense |
$0 |
$0 |
$0 |
$0 |
$0 |
$0 |
$0 |
$0 |
$0 |
$0 |
$0 |
$0 |
|
|
Taxes Incurred |
$0 |
$0 |
$0 |
$0 |
$0 |
$0 |
$0 |
$0 |
$0 |
$0 |
$0 |
$0 |
|
|
Net Profit |
($2,789) |
($1,881) |
($1,692) |
($1,550) |
($794) |
($39) |
$39 |
$365 |
$514 |
$943 |
$1,254 |
$1,700 |
|
|
Net Profit/Sales |
0.00% |
-196.89% |
-146.47% |
-118.92% |
-37.81% |
-1.36% |
1.31% |
10.99% |
14.79% |
24.01% |
29.47% |
35.97% |
|
|
Pro Forma Cash Flow |
|||||||||||||
|
Month 1 |
Month 2 |
Month 3 |
Month 4 |
Month 5 |
Month 6 |
Month 7 |
Month 8 |
Month 9 |
Month 10 |
Month 11 |
Month 12 |
||
|
Cash Received |
|||||||||||||
|
Cash from Operations |
|||||||||||||
|
Cash Sales |
$0 |
$956 |
$1,155 |
$1,304 |
$2,100 |
$2,895 |
$2,977 |
$3,320 |
$3,477 |
$3,929 |
$4,256 |
$4,725 |
|
|
Subtotal Cash from Operations |
$0 |
$956 |
$1,155 |
$1,304 |
$2,100 |
$2,895 |
$2,977 |
$3,320 |
$3,477 |
$3,929 |
$4,256 |
$4,725 |
|
|
Additional Cash Received |
|||||||||||||
|
Sales Tax, VAT, HST/GST Received |
0.00% |
$0 |
$0 |
$0 |
$0 |
$0 |
$0 |
$0 |
$0 |
$0 |
$0 |
$0 |
$0 |
|
New Current Borrowing |
$0 |
$0 |
$0 |
$0 |
$0 |
$0 |
$0 |
$0 |
$0 |
$0 |
$0 |
$0 |
|
|
New Other Liabilities (interest-free) |
$0 |
$0 |
$0 |
$0 |
$0 |
$0 |
$0 |
$0 |
$0 |
$0 |
$0 |
$0 |
|
|
New Long-term Liabilities |
$0 |
$0 |
$0 |
$0 |
$0 |
$0 |
$0 |
$0 |
$0 |
$0 |
$0 |
$0 |
|
|
Sales of Other Current Assets |
$0 |
$0 |
$0 |
$0 |
$0 |
$0 |
$0 |
$0 |
$0 |
$0 |
$0 |
$0 |
|
|
Sales of Long-term Assets |
$0 |
$0 |
$0 |
$0 |
$0 |
$0 |
$0 |
$0 |
$0 |
$0 |
$0 |
$0 |
|
|
New Investment Received |
$0 |
$0 |
$0 |
$0 |
$0 |
$0 |
$0 |
$0 |
$0 |
$0 |
$0 |
$0 |
|
|
Subtotal Cash Received |
$0 |
$956 |
$1,155 |
$1,304 |
$2,100 |
$2,895 |
$2,977 |
$3,320 |
$3,477 |
$3,929 |
$4,256 |
$4,725 |
|
|
Expenditures |
Month 1 |
Month 2 |
Month 3 |
Month 4 |
Month 5 |
Month 6 |
Month 7 |
Month 8 |
Month 9 |
Month 10 |
Month 11 |
Month 12 |
|
|
Expenditures from Operations |
|||||||||||||
|
Cash Spending |
$2,500 |
$2,500 |
$2,500 |
$2,500 |
$2,500 |
$2,500 |
$2,500 |
$2,500 |
$2,500 |
$2,500 |
$2,500 |
$2,500 |
|
|
Bill Payments |
$8 |
$252 |
$298 |
$308 |
$317 |
$356 |
$395 |
$399 |
$416 |
$425 |
$447 |
$464 |
|
|
Subtotal Spent on Operations |
$2,508 |
$2,752 |
$2,798 |
$2,808 |
$2,817 |
$2,856 |
$2,895 |
$2,899 |
$2,916 |
$2,925 |
$2,947 |
$2,964 |
|
|
Additional Cash Spent |
|||||||||||||
|
Sales Tax, VAT, HST/GST Paid Out |
$0 |
$0 |
$0 |
$0 |
$0 |
$0 |
$0 |
$0 |
$0 |
$0 |
$0 |
$0 |
|
|
Principal Repayment of Current Borrowing |
$0 |
$0 |
$0 |
$0 |
$0 |
$0 |
$0 |
$0 |
$0 |
$0 |
$0 |
$0 |
|
|
Other Liabilities Principal Repayment |
$0 |
$0 |
$0 |
$0 |
$0 |
$0 |
$0 |
$0 |
$0 |
$0 |
$0 |
$0 |
|
|
Long-term Liabilities Principal Repayment |
$0 |
$0 |
$0 |
$0 |
$0 |
$0 |
$0 |
$0 |
$0 |
$0 |
$0 |
$0 |
|
|
Purchase Other Current Assets |
$0 |
$0 |
$0 |
$0 |
$0 |
$0 |
$0 |
$0 |
$0 |
$0 |
$0 |
$0 |
|
|
Purchase Long-term Assets |
$0 |
$0 |
$0 |
$0 |
$0 |
$0 |
$0 |
$0 |
$0 |
$0 |
$0 |
$0 |
|
|
Dividends |
$0 |
$0 |
$0 |
$0 |
$0 |
$0 |
$0 |
$0 |
$0 |
$0 |
$0 |
$0 |
|
|
Subtotal Cash Spent |
$2,508 |
$2,752 |
$2,798 |
$2,808 |
$2,817 |
$2,856 |
$2,895 |
$2,899 |
$2,916 |
$2,925 |
$2,947 |
$2,964 |
|
|
Net Cash Flow |
($2,508) |
($1,796) |
($1,643) |
($1,504) |
($717) |
$38 |
$82 |
$420 |
$561 |
$1,004 |
$1,309 |
$1,761 |
|
|
Cash Balance |
$9,542 |
$7,746 |
$6,102 |
$4,598 |
$3,882 |
$3,920 |
$4,002 |
$4,422 |
$4,983 |
$5,987 |
$7,296 |
$9,058 |
|
|
Pro Forma Balance Sheet |
|||||||||||||
|
Month 1 |
Month 2 |
Month 3 |
Month 4 |
Month 5 |
Month 6 |
Month 7 |
Month 8 |
Month 9 |
Month 10 |
Month 11 |
Month 12 |
||
|
Assets |
Starting Balances |
||||||||||||
|
Current Assets |
|||||||||||||
|
Cash |
$12,050 |
$9,542 |
$7,746 |
$6,102 |
$4,598 |
$3,882 |
$3,920 |
$4,002 |
$4,422 |
$4,983 |
$5,987 |
$7,296 |
$9,058 |
|
Other Current Assets |
$0 |
$0 |
$0 |
$0 |
$0 |
$0 |
$0 |
$0 |
$0 |
$0 |
$0 |
$0 |
$0 |
|
Total Current Assets |
$12,050 |
$9,542 |
$7,746 |
$6,102 |
$4,598 |
$3,882 |
$3,920 |
$4,002 |
$4,422 |
$4,983 |
$5,987 |
$7,296 |
$9,058 |
|
Long-term Assets |
|||||||||||||
|
Long-term Assets |
$0 |
$0 |
$0 |
$0 |
$0 |
$0 |
$0 |
$0 |
$0 |
$0 |
$0 |
$0 |
$0 |
|
Accumulated Depreciation |
$0 |
$39 |
$78 |
$117 |
$156 |
$195 |
$234 |
$273 |
$312 |
$351 |
$390 |
$429 |
$468 |
|
Total Long-term Assets |
$0 |
($39) |
($78) |
($117) |
($156) |
($195) |
($234) |
($273) |
($312) |
($351) |
($390) |
($429) |
($468) |
|
Total Assets |
$12,050 |
$9,503 |
$7,668 |
$5,985 |
$4,442 |
$3,687 |
$3,686 |
$3,729 |
$4,110 |
$4,632 |
$5,597 |
$6,867 |
$8,590 |
|
Liabilities and Capital |
Month 1 |
Month 2 |
Month 3 |
Month 4 |
Month 5 |
Month 6 |
Month 7 |
Month 8 |
Month 9 |
Month 10 |
Month 11 |
Month 12 |
|
|
Current Liabilities |
|||||||||||||
|
Accounts Payable |
$0 |
$242 |
$288 |
$297 |
$305 |
$343 |
$382 |
$386 |
$402 |
$410 |
$432 |
$447 |
$470 |
|
Current Borrowing |
$0 |
$0 |
$0 |
$0 |
$0 |
$0 |
$0 |
$0 |
$0 |
$0 |
$0 |
$0 |
$0 |
|
Other Current Liabilities |
$0 |
$0 |
$0 |
$0 |
$0 |
$0 |
$0 |
$0 |
$0 |
$0 |
$0 |
$0 |
$0 |
|
Subtotal Current Liabilities |
$0 |
$242 |
$288 |
$297 |
$305 |
$343 |
$382 |
$386 |
$402 |
$410 |
$432 |
$447 |
$470 |
|
Long-term Liabilities |
$0 |
$0 |
$0 |
$0 |
$0 |
$0 |
$0 |
$0 |
$0 |
$0 |
$0 |
$0 |
$0 |
|
Total Liabilities |
$0 |
$242 |
$288 |
$297 |
$305 |
$343 |
$382 |
$386 |
$402 |
$410 |
$432 |
$447 |
$470 |
|
Paid-in Capital |
$15,000 |
$15,000 |
$15,000 |
$15,000 |
$15,000 |
$15,000 |
$15,000 |
$15,000 |
$15,000 |
$15,000 |
$15,000 |
$15,000 |
$15,000 |
|
Retained Earnings |
($2,950) |
($2,950) |
($2,950) |
($2,950) |
($2,950) |
($2,950) |
($2,950) |
($2,950) |
($2,950) |
($2,950) |
($2,950) |
($2,950) |
($2,950) |
|
Earnings |
$0 |
($2,789) |
($4,670) |
($6,362) |
($7,912) |
($8,706) |
($8,746) |
($8,707) |
($8,342) |
($7,828) |
($6,884) |
($5,630) |
($3,930) |
|
Total Capital |
$12,050 |
$9,261 |
$7,380 |
$5,688 |
$4,138 |
$3,344 |
$3,304 |
$3,343 |
$3,708 |
$4,222 |
$5,166 |
$6,420 |
$8,120 |
|
Total Liabilities and Capital |
$12,050 |
$9,503 |
$7,668 |
$5,985 |
$4,442 |
$3,687 |
$3,686 |
$3,729 |
$4,110 |
$4,632 |
$5,597 |
$6,867 |
$8,590 |
|
Net Worth |
$12,050 |
$9,261 |
$7,380 |
$5,688 |
$4,138 |
$3,344 |
$3,304 |
$3,343 |
$3,708 |
$4,222 |
$5,166 |
$6,420 |
$8,120 |