Consulting Seminars Business Plan
Seminars
Executive Summary
Seminars is a focused seminar company that offers a powerful combination of seminars along with the software to make them useful. It is being founded in Eugene, OR. It will offer business plan seminars and business plan software together.
1.1 Mission
Seminars in business planning and related subject areas offer their participants an accelerated learning environment including both tools and the know-how to use them. This is a focused educational experience that short-cuts normal business schools with the fundamental knowledge required, in a practical setting. The business provides a comfortable living for its owners, fair compensation to employees, and a creative, healthy work environment.
1.2 Keys to Success
- Repeat business with corporate customers.
- Seminar-oriented sales and marketing to generate people in the seats.
- Leveraging on sales and marketing alliances.
1.3 Objectives
- Achieve cash flow self sufficiency by the end of the first year.
- Repay debt from original financing by the end of the second year.
- Provide an income for founder-owner with income growth possibilities.
- Sales of $200K in the first year.
- Sales of more than $500K by the third year.
· Company Summary
· Seminars is a focused seminar company that offers a powerful combination of seminars along with the software to make them useful. This company is about realizing the potential of its founder, John Doe, to develop his skills and knowledge into a viable business.
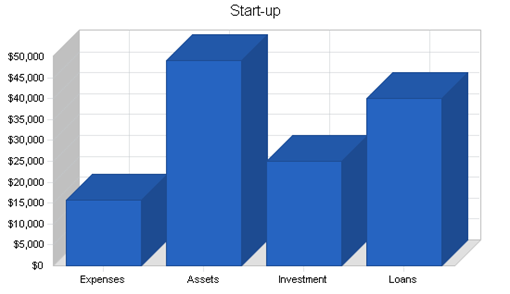
· 2.1 Start-up Summary
· Start-up costs and initial financing are shown on the following table. John Doe will be investing $25,000 of savings and guaranteeing a loan for another $30,000 with personal assets. The Web development vendor, Designato, has agreed to develop the website for $10,000 to be paid in a year's time. That will go on the books as an interest-free loan.
·
·
|
Start-up Requirements |
|
|
Start-up Expenses |
|
|
Legal |
$500 |
|
Stationery etc. |
$300 |
|
Website |
$10,000 |
|
Rent |
$1,000 |
|
Expensed Equipment |
$3,000 |
|
Other |
$1,000 |
|
Total Start-up Expenses |
$15,800 |
|
Start-up Assets |
|
|
Cash Required |
$47,200 |
|
Other Current Assets |
$2,000 |
|
Long-term Assets |
$0 |
|
Total Assets |
$49,200 |
|
Total Requirements |
$65,000 |
·
|
Start-up Funding |
|
|
Start-up Expenses to Fund |
$15,800 |
|
Start-up Assets to Fund |
$49,200 |
|
Total Funding Required |
$65,000 |
|
Assets |
|
|
Non-cash Assets from Start-up |
$2,000 |
|
Cash Requirements from Start-up |
$47,200 |
|
Additional Cash Raised |
$0 |
|
Cash Balance on Starting Date |
$47,200 |
|
Total Assets |
$49,200 |
|
Liabilities and Capital |
|
|
Liabilities |
|
|
Current Borrowing |
$30,000 |
|
Long-term Liabilities |
$0 |
|
Accounts Payable (Outstanding Bills) |
$0 |
|
Other Current Liabilities (interest-free) |
$10,000 |
|
Total Liabilities |
$40,000 |
|
Capital |
|
|
Planned Investment |
|
|
Owner/founder |
$25,000 |
|
Other |
$0 |
|
Additional Investment Requirement |
$0 |
|
Total Planned Investment |
$25,000 |
|
Loss at Start-up (Start-up Expenses) |
($15,800) |
|
Total Capital |
$9,200 |
|
Total Capital and Liabilities |
$49,200 |
|
Total Funding |
$65,000 |
· 2.2 Company Locations and Facilities
· Seminars will be located in Eugene, OR. Eugene is not an ideal location for a seminar business, because it is not within any major market; but local costs are lower than average, and it is striking distance from Seattle, San Francisco, Los Angeles, and of course Portland, OR. The main consideration is that the founder lives in Eugene, and this business is for his benefit.
· 2.3 Company Ownership
· At its initial stages, Seminars is a sole proprietorship owned by John Doe, founder and president. It will be registered with the county as a fictitious business name. We will move up to incorporate as recommended by our attorney later, based on growth of the business and conditions as they arise.
Services
The founder likes public speaking, and particularly likes his hands-on seminar-and-software combinations that develop business planning by providing not just the know-how, but the tools as well, to help people in business plan better.
He's done a lot of it. He's given full-day business planning seminars in the U.S., Mexico, Japan, Thailand, Singapore, Hong Kong, Argentina, Chile, Colombia, Venezuela, and Puerto Rico. He's also done them at SBDC sites in four states, and at business schools including University of Oregon, Harvard, and UC Berkeley.
We won't use seminars to sell software. We hate the use of seminars as thinly-disguised sales pitches. Instead, we insist on bundling the software into the seminar so we can focus on the real task at hand, the tools provided, and how to get the most out of them. If we don't have time for the full hands-on treatment, or the event calls for a more general discussion of business planning, I'll still take the date but the discussion will be more general. We won't include product details or a sales pitch.
We can't teach business planning in a one-day seminar. We can, however, achieve basic familiarity with the process and the tools. We can also break down the fear. Sometimes the hardest thing about a business plan is getting started.
As participants walk out of one of these sessions, they walk out armed with not just the desire to follow up and make it work for their business, but also the tools to make it happen.
The software used in these seminars is very high quality and professional business and marketing planning software, each the market leader in its category: Business Plan Pro, Marketing Plan Pro, and Web Strategy Pro.
3.1 Service Description
Business Planning
- We've done speaking and seminars on developing a business plan in more than a dozen countries, as well as all over the United States. I've spent more than 20 years developing business plans, writing about business plans, and developing software to help people develop business plans.
- Sample agenda.
- Sample presentation slides.
Marketing Planning
- As co-authors of the book on Marketing Plans (On Target) we can take a group through the process with emphasis on real-world practical planning, with implementation built in.
- Sample agenda.
- Sample presentation slides.
Entrepreneurship
- How to start your own business, business start-ups in general, managing the start-up company, the process of developing and financing a new business.
Developing a Web strategy
- John Doe has been involved in a very successful Web business, with complete download store, hundreds of affiliates, revenues and profits.
3.2 Competitive Comparison
Business plan seminars run from free seminars intended to sell products or services to high-end seminars sponsored by the American Management Association and similar organizations. We don't feel that the market is well covered.
For a broader view of competition, we look at both other seminars and other competing offerings of similar tools and know-how:
- Books.
- Magazine articles.
- Classes in local junior colleges, night school, business schools.
- Stand-alone software.
- Low-end, often free entrepreneurial seminars. Some are offered by Small Business Development Centers (SBDCs) for little or no money.
- Professional seminars for $100 or more.
3.3 Sales Literature
Our main sales literature is the website at www.[omitted].com. Sales literature is obsolete for our purposes, we use the website to explain and back up.
3.4 Fulfillment
Seminars presentations will only be given by true experts, either John Doe himself or substitutes with proven track record, academic background, and practical business experience. They must be good speakers and good seminar leaders. We cannot afford to have anything but the best.
Seminars should always be delivered with projection of presentation materials through a projector. Seminars more than three hours should always be delivered with at least one computer per every three participants, so they can follow along with the software.
We cannot afford to compromise quality with second-rate delivery. Always the best equipment, always well prepared, well rested, and well delivered. This is vital.
3.5 Technology
Laptop and projection are absolutely essential. We'll upgrade the technology as better becomes available. For now at least that's enough to guarantee a minimum level.
3.6 Future Services
We will remain aware of new technologies that might lead to new services, such as the online seminar or video/CD seminar, that can be packaged and made available to our clients.
Market Analysis Summary
There are several separate markets for this kind of seminar:
- Corporations with interest in improving the planning of groups or individuals either inside the corporation or related to the corporation. The most obvious are the larger corporations that market through separate channel entities, such as distributors selling to dealers, manufacturers selling through dealers.
- Owners and managers of smaller- or intermediate-sized businesses.
- Individuals looking to either start their own businesses or improve their business planning skills and knowledge.
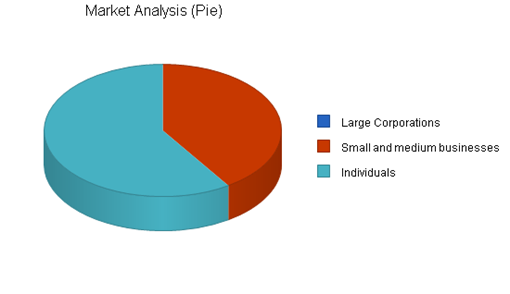
4.1 Market Segmentation
The total potential market in units is shown in the following table and chart, by type of market point. The larger corporations don't show up in the chart because they are dwarfed in gross unit numbers, but of course they do contribute a major potential market to the business.
![]()
|
Market Analysis |
|||||||
|
Year 1 |
Year 2 |
Year 3 |
Year 4 |
Year 5 |
|||
|
Potential Customers |
Growth |
CAGR |
|||||
|
Large Corporations |
0% |
500 |
500 |
500 |
500 |
500 |
0.00% |
|
Small and medium businesses |
2% |
11,000,000 |
11,220,000 |
11,444,400 |
11,673,288 |
11,906,754 |
2.00% |
|
Individuals |
1% |
16,000,000 |
16,160,000 |
16,321,600 |
16,484,816 |
16,649,664 |
1.00% |
|
Total |
1.41% |
27,000,500 |
27,380,500 |
27,766,500 |
28,158,604 |
28,556,918 |
1.41% |
4.2 Target Market Segment Strategy
- For the corporate market we need to focus on specific companies with specific opportunities. They should all be companies that work with independent channel points, because these are the most likely buyers. Channel development or channel marketing is the main job area for the first push.
- For small and medium businesses we need to focus on organizations that can lever our market offering: the American Management Association, for example, the AICPA, trade associations and industry associations, perhaps some magazine publishers if they survive the 2001 shakeout.
- For individuals we need to lever off organizations that cater to individuals looking to start up their own businesses: that might include SBDCs and publications, websites such as www.bplans.com, and others.
4.2.1 Market Trends
It's hard to find businesses dedicated to developing this kind of seminar. In general, seminars are an additional revenue generator in businesses or organizations that have other major objectives. For example, seminars are developed and offered by SBDCs, the AMA, chambers of commerce.
As a result, market trends are unclear. Has the development of software affected this market? We're not sure. Larger well-organized seminar businesses have not developed.
4.2.2 Market Growth
We have no indication of market growth in this pulverized and diffuse market. No statistics are available. What we do know is that there is growth potential, and plenty of potential market.
4.2.3 Market Needs
The underlying need is accelerated learning. Developing business plans isn't a skill people normally include in standard curricula for standard education, it is a skill considered ad-hoc, a specialized skill developed and exercised for a specialized task.
Those who don't have time for academic learning still need to develop business plans, and the seminar gives them a chance to gain familiarity in a few hours. Combined with business plan software, they can move forward and reduce the fear, break the pattern of procrastination, and move ahead with their planning.
In some market niches, seminars may serve their participants as continuing education required by professional licensors. This could be true for CPAs, for example, or attorneys.
In the large corporation context, there are additional market needs. Companies that market through channel partners need three things related to business plans:
- Business information from the channel partners about business conditions, plans, projections, and business programs.
- Consistency of numbers, definitions, business models, forecasts, and analysis.
- Useful realistic planning.
- Occasions suitable for regular meetings with events--such as business plan seminars--that can attract independent small businesses to attent those meetings. They use the meeting to announce new products, marketing programs, etc. Meetings are often held in attractive vacation locations so channel partners can combine business with vacations.
4.3 Service Business Analysis
The business plan seminar business is very diverse. It ranges from the high end, colleges and universities and some consulting companies offer serious multi-day seminars in planning and strategic planning for hundreds and even thousands of dollars.
4.3.1 Competition and Buying Patterns
- At the high end, colleges and universities and some consulting companies offer serious multi-day seminars in planning and strategic planning for hundreds and even thousands of dollars.
- There are also very serious seminar offerings from organizations such as the AMA, AICPA, etc. These tend to cost above $500.
- Useful seminars are offered as well by SBDCs, smaller colleges and universities, community colleges, and even high school night school programs. Many of these are free, or close to free.
- There are also related seminars offered by vendors of get-rich-quick schemes and multi-level marketing programs. These unfortunately add noise to the market, confuse potential participants between real value and thinly-disguised sales pitches.
4.3.2 Main Competitors
The way this business is positioned, we should try to work with our main competitors, instead of compete with them. AMA, AICPA, and business schools could be co-sponsors and allies rather than competitors.
Other competition would be business plan consultants, and in a sense all low-end business plan seminars.
4.3.3 Business Participants
The business plan seminar business is very diverse. It ranges from high-end seminars lasting more than a day and costing more than $1,000, to free sales pitches intended to draw would-be entrepreneurs for the purpose of selling products.
Strategy and Implementation Summary
The main thrust of strategy is to lever our identification with business plan software to offer seminars with real content and real value that will be useful to the participants. We understand the underlying needs and give the customer what they really need.
5.1 Value Proposition
In the corporate market: our clients get channel development programs that increase the quality of channel information, enhance the businesses of channel partners, and improve the attendance of programmed meetings, at a price commensurate with real value offered.
In the mainstream market: our clients get accelerated learning in a few hours with software to take home that vastly increases the value and likelihood of success.
5.2 Competitive Edge
Our most important competitive edge is the intimate link with the planning software. While other seminars may offer their participants content, we offer them both know-how and tools to use that know-how. They walk out of the seminar with a much higher likelihood of actually using it.
5.3 Marketing Strategy
Our marketing strategy is based on making our value proposition known to the potential market (through contacts, selling, leverage with allies, and the website) and focusing on the market needs of the main potential clients.
5.3.1 Promotion Strategy
Promotion is the hardest part. One of our key gaps as this plan is written is the sales and marketing manager with real seminar marketing experience. We need to build programs that work.
5.3.2 Marketing Programs
- The website.
- Email newsletter list.
- Alliances with key organizations including SBDC, Chambers of Commerce, SCORE, AICPA, and AMA.
5.3.3 Positioning Statement
For companies marketing through channels, our business plan seminars provide better planning, better business information, and higher attendance at planned meetings. Unlike normal seminars, ours come with software included so participants will be much more likely to use it.
For entrepreneurs wanting to develop a business plan, our seminars gives them an accelerated head start that enhances knowledge and reduces fear. Unlike normal seminars, ours come with software included so participants will be much more likely to actually develop that plan, not just think about it.
5.3.4 Pricing Strategy
Our seminars should be priced above the medium, but not so high as to rule out participation from entrepreneurs. We aim for $495 per participant in the mainstream seminars, and $5,000 per day plus $100 per participant in the corporate market.
5.4 Sales Strategy
We need to be able to offer schedules and agendas off of our website, from which we can register clients as easily as possible. We should also set up a toll-free number to take registrations, probably through an answering service until the sales and marketing manager is on board.
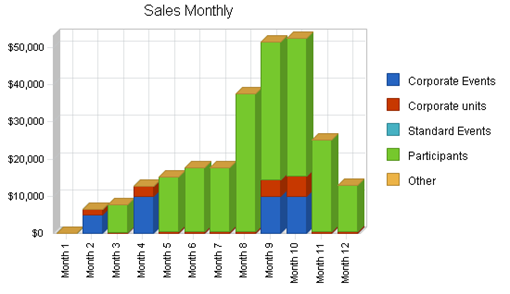
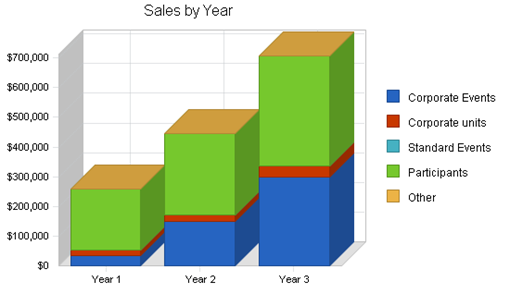
5.4.1 Sales Forecast
The following table and chart illustrate the sales forecast. We're sure this is a manageable forecast.
|
Sales Forecast |
|||
|
Year 1 |
Year 2 |
Year 3 |
|
|
Unit Sales |
|||
|
Corporate Events |
7 |
10 |
15 |
|
Corporate units |
187 |
250 |
400 |
|
Standard Events |
19 |
22 |
25 |
|
Participants |
415 |
550 |
750 |
|
Other |
0 |
0 |
0 |
|
Total Unit Sales |
628 |
832 |
1,190 |
|
Unit Prices |
Year 1 |
Year 2 |
Year 3 |
|
Corporate Events |
$5,000.00 |
$15,000.00 |
$20,000.00 |
|
Corporate units |
$90.00 |
$90.00 |
$90.00 |
|
Standard Events |
$0.00 |
$0.00 |
$0.00 |
|
Participants |
$495.00 |
$495.00 |
$495.00 |
|
Other |
$0.00 |
$0.00 |
$0.00 |
|
Sales |
|||
|
Corporate Events |
$35,000 |
$150,000 |
$300,000 |
|
Corporate units |
$16,830 |
$22,500 |
$36,000 |
|
Standard Events |
$0 |
$0 |
$0 |
|
Participants |
$205,425 |
$272,250 |
$371,250 |
|
Other |
$0 |
$0 |
$0 |
|
Total Sales |
$257,255 |
$444,750 |
$707,250 |
|
Direct Unit Costs |
Year 1 |
Year 2 |
Year 3 |
|
Corporate Events |
$500.00 |
$500.00 |
$500.00 |
|
Corporate units |
$75.00 |
$75.00 |
$75.00 |
|
Standard Events |
$2,000.00 |
$2,000.00 |
$2,000.00 |
|
Participants |
$100.00 |
$100.00 |
$100.00 |
|
Other |
$0.00 |
$0.00 |
$0.00 |
|
Direct Cost of Sales |
|||
|
Corporate Events |
$3,500 |
$5,000 |
$7,500 |
|
Corporate units |
$14,025 |
$18,750 |
$30,000 |
|
Standard Events |
$38,000 |
$44,000 |
$50,000 |
|
Participants |
$41,500 |
$55,000 |
$75,000 |
|
Other |
$0 |
$0 |
$0 |
|
Subtotal Direct Cost of Sales |
$97,025 |
$122,750 |
$162,500 |
5.5 Strategic Alliances
Strategic alliances will be critical to this business. We need to develop alliances with entrepreneurial websites, SBDCs, AICPA, AMA, and others.
5.6 Milestones
The main milestones are shown in the following table and chart. The key is actually implementing the plan.
|
Milestones |
|||||
|
Milestone |
Start Date |
End Date |
Budget |
Manager |
Department |
|
Website plan |
1/1/2002 |
3/1/2002 |
$1,000 |
Designato |
Website |
|
Website implementation |
2/15/2002 |
5/1/2002 |
$9,000 |
Designato |
Website |
|
Recruitment marketing person |
1/15/2002 |
3/1/2002 |
$2,000 |
Founder |
Management |
|
Sales contacts and networking |
1/15/2002 |
4/1/2002 |
$2,000 |
Founder |
Management |
|
Initial market communication |
3/15/2002 |
6/1/2002 |
$5,000 |
Marketing |
Marketing |
|
Bank loan |
12/1/2001 |
1/1/2002 |
$0 |
Founder |
Management |
|
First corporate seminar |
1/1/2002 |
3/31/2002 |
$2,000 |
Founder |
Management |
|
Second corporate seminar |
3/31/2002 |
5/1/2002 |
$2,000 |
Marketing |
Marketing |
|
First mainstream seminar |
4/1/2002 |
5/1/2002 |
$2,000 |
Marketing |
Marketing |
|
Totals |
$25,000 |
||||
Web Plan Summary
As with so many similar business, the website is a critical part of the marketing plan. Potential clients expect it. The website will be used to generate leads--through searcher strategies--and to close sales--through reinforcement and information.
6.1 Website Marketing Strategy
The main website marketing strategy is searcher placement. We depend on careful searcher strategies with the main searchers. Placement is critical. There is no budget for banner advertising.
The second main promotional strategy is the website alliance. We will need to establish affiliations with key related sites, offering valuable content in return for strategic placement.
6.2 Development Requirements
The website will be mainly information, emphasizing event schedules, agendas, qualifications, and online registration. The most complex portion of it will be the online forms for registration.
Management Summary
This is a small company with three employees: founder, sales and marketing manager, and administrative assistant. We may contract with additional seminar leaders as sales events demand.
7.1 Management Team
John Doe, 53, was president of [name omitted], and the principal author of its software products including Business Plan Pro and Marketing Plan Pro. He is also the author of several other software products, six published books, and magazine articles. He has given seminars on business planning, for large and small companies, in more than a dozen countries.
His most recent book, Hurdle: the Book on Business Planning, is a step-by-step guide to practical business planning. It was published in 1998 by Palo Alto Software, and is republished as part of the Business Plan Pro manual. He is also the author of CPA's Guide to Business Planning, originally published by Harcourt Brace Professional Publishing, now in its fourth edition, published by Aspen Publishers (which purchased Harcourt Brace in 2000). Earlier he wrote Working Smart with Electronic Spreadsheets, published by Hayden Books in 1984, Jazz: The Inside Track, published by McGraw-Hill in 1985, and (with Jane Rovira) Mexico, New Look at a Maturing Market, published by Business International in 1979. He also wrote a monthly column in Business Software magazine during the 1980s, and articles published by MacWorld, Mac User, Mac Business Review, and Personal Computing. He has written software published by MLT Publishing. His works published by Palo Alto Software include Business Plan Toolkit, Financial Forecasting Toolkit, Sales and Market Forecasting Toolkit, Business Management Toolkit, Business Budgeting Toolkit, and Marketing Plan Toolkit, as well as the two still-living products noted in the first paragraph.
A Stanford MBA, Doe has been a successful business consultant and entrepreneur, a co-founder of Borland International, one of the largest companies in software, and consultant to high-growth computer companies. He is listed in the index of Fire in the Valley, by Swain and Freiburger, the history of the personal computer industry.
After graduating magna cum laude from the University of Notre Dame and receiving an MA with honors from the University of Oregon, Doe was a journalist based in Mexico City during most of the 1970s. He was correspondent for United Press International, Business Week, Business International, and other publications. He became head of Mexico-based business consulting and research for Business International, and left Mexico in 1979 to enroll in the Graduate School of Business at Stanford University.
While studying for an MBA degree he was a full-time consultant to Creative Strategies, where he became vice president for Software Research after graduating with an MBA degree in 1981. In 1983 he founded Infoplan, which later became Palo Alto Software. During the 1980s and early 1990s he consulted in business planning and marketing planning to companies including Apple Computer, Hewlett Packard, and IBM. Apple Latin America grew from $4 million annual sales to more than $30 million during the four years he did its business planning as a consultant, and Apple Japan grew from less than $200 million per year to $1.5 billion in sales during the four years he worked with that organization as a consultant. In 1983 he was a co-founder of Borland International, one of four members of the board of directors. He resigned that position in 1986 when Borland went public. He has been president of Palo Alto Software since it was started, and has taken it to market leadership, 30 employees, and more than $5 million in annual sales, without outside investment until this year.
7.2 Management Team Gaps
This business plan depends on finding the right sales and marketing person. This is a full-time job with a good future.
7.3 Personnel Plan
The personnel plan shows in detail in the following table.
|
Personnel Plan |
|||
|
Year 1 |
Year 2 |
Year 3 |
|
|
Owner/founder |
$42,000 |
$55,000 |
$75,000 |
|
Sales/marketing |
$36,000 |
$45,000 |
$60,000 |
|
Admin Assistance |
$24,000 |
$30,000 |
$35,000 |
|
Contractors |
$0 |
$15,000 |
$25,000 |
|
Total People |
3 |
3 |
3 |
|
Total Payroll |
$102,000 |
$145,000 |
$195,000 |
Financial Plan
The financial plan depends on initial investment of $25K from the founder plus a five-year loan of $30K. Much as we'd like to bootstrap this business without initial investment, it just isn't worth it. The rest of the plan is reasonably conservative, but there does have to be money at risk.
The bank loan will be secured with real estate owned by the founder.
8.1 Important Assumptions
Important general assumptions are shown in the following table.
|
General Assumptions |
|||
|
Year 1 |
Year 2 |
Year 3 |
|
|
Plan Month |
1 |
2 |
3 |
|
Current Interest Rate |
10.00% |
10.00% |
10.00% |
|
Long-term Interest Rate |
10.00% |
10.00% |
10.00% |
|
Tax Rate |
30.00% |
30.00% |
30.00% |
|
Other |
0 |
0 |
0 |
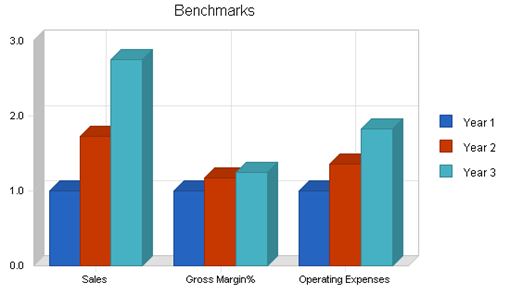
8.2 Key Financial Indicators
The benchmarks chart shows changes in sales, operating expenses, gross margin, and collection days. We think the chart speaks for itself, and what it says is that the numbers and assumptions are reasonable.
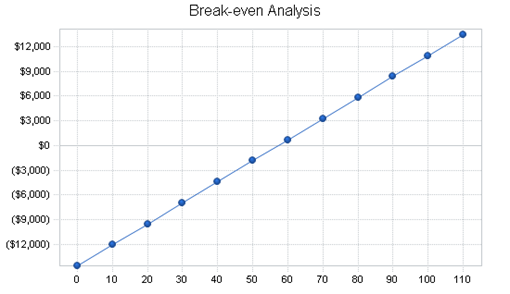
8.3 Break-even Analysis
Unfortunately, the break-even analysis shows that it takes more than $20,000 per month in sales to break even. That's not an easy figure to make, especially not in the beginning before the marketing efforts begin to take effect.
|
Break-even Analysis |
|
|
Monthly Units Break-even |
57 |
|
Monthly Revenue Break-even |
$23,441 |
|
Assumptions: |
|
|
Average Per-Unit Revenue |
$409.64 |
|
Average Per-Unit Variable Cost |
$154.50 |
|
Estimated Monthly Fixed Cost |
$14,600 |
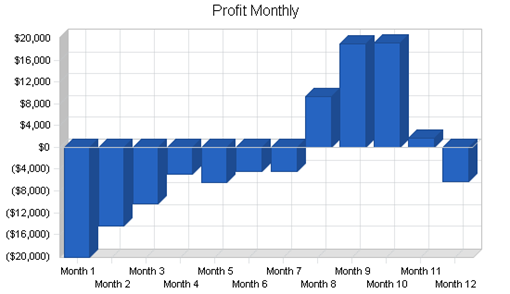
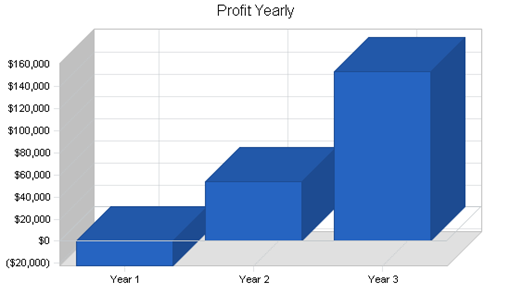
8.4 Projected Profit and Loss
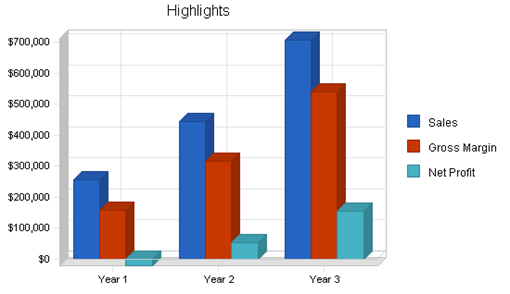
As shown in the following table, the business doesn't make money in the first year, but turns very profitable in the third.
|
Pro Forma Profit and Loss |
|||
|
Year 1 |
Year 2 |
Year 3 |
|
|
Sales |
$257,255 |
$444,750 |
$707,250 |
|
Direct Cost of Sales |
$97,025 |
$122,750 |
$162,500 |
|
Other Production Expenses |
$3,500 |
$5,000 |
$5,000 |
|
Total Cost of Sales |
$100,525 |
$127,750 |
$167,500 |
|
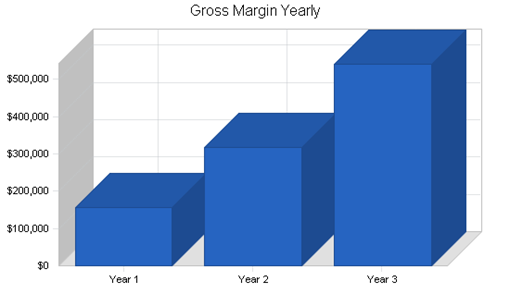
Gross Margin |
$156,730 |
$317,000 |
$539,750 |
|
Gross Margin % |
60.92% |
71.28% |
76.32% |
|
Expenses |
|||
|
Payroll |
$102,000 |
$145,000 |
$195,000 |
|
Sales and Marketing and Other Expenses |
$49,000 |
$62,500 |
$86,000 |
|
Depreciation |
$0 |
$0 |
$0 |
|
Utilities |
$2,400 |
$2,400 |
$2,400 |
|
Insurance |
$500 |
$500 |
$500 |
|
Rent |
$6,000 |
$6,600 |
$7,200 |
|
Payroll Taxes |
$15,300 |
$21,750 |
$29,250 |
|
Other |
$0 |
$0 |
$0 |
|
Total Operating Expenses |
$175,200 |
$238,750 |
$320,350 |
|
Profit Before Interest and Taxes |
($18,470) |
$78,250 |
$219,400 |
|
EBITDA |
($18,470) |
$78,250 |
$219,400 |
|
Interest Expense |
$3,678 |
$1,257 |
$0 |
|
Taxes Incurred |
$0 |
$23,098 |
$65,820 |
|
Net Profit |
($22,148) |
$53,895 |
$153,580 |
|
Net Profit/Sales |
-8.61% |
12.12% |
21.72% |
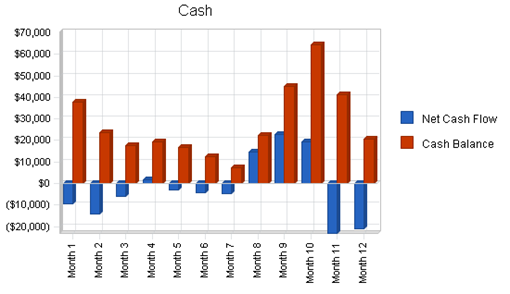
8.5 Projected Cash Flow
With the financing plan as projected, the business remains cash positive throughout the first three years. That does depend of course on investment capital and loans.
|
Pro Forma Cash Flow |
|||
|
Year 1 |
Year 2 |
Year 3 |
|
|
Cash Received |
|||
|
Cash from Operations |
|||
|
Cash Sales |
$257,255 |
$444,750 |
$707,250 |
|
Subtotal Cash from Operations |
$257,255 |
$444,750 |
$707,250 |
|
Additional Cash Received |
|||
|
Sales Tax, VAT, HST/GST Received |
$0 |
$0 |
$0 |
|
New Current Borrowing |
$15,000 |
$0 |
$0 |
|
New Other Liabilities (interest-free) |
$0 |
$0 |
$0 |
|
New Long-term Liabilities |
$0 |
$0 |
$0 |
|
Sales of Other Current Assets |
$0 |
$0 |
$0 |
|
Sales of Long-term Assets |
$0 |
$0 |
$0 |
|
New Investment Received |
$0 |
$0 |
$0 |
|
Subtotal Cash Received |
$272,255 |
$444,750 |
$707,250 |
|
Expenditures |
Year 1 |
Year 2 |
Year 3 |
|
Expenditures from Operations |
|||
|
Cash Spending |
$102,000 |
$145,000 |
$195,000 |
|
Bill Payments |
$167,195 |
$235,855 |
$349,398 |
|
Subtotal Spent on Operations |
$269,195 |
$380,855 |
$544,398 |
|
Additional Cash Spent |
|||
|
Sales Tax, VAT, HST/GST Paid Out |
$0 |
$0 |
$0 |
|
Principal Repayment of Current Borrowing |
$19,868 |
$25,132 |
$0 |
|
Other Liabilities Principal Repayment |
$10,000 |
$0 |
$0 |
|
Long-term Liabilities Principal Repayment |
$0 |
$0 |
$0 |
|
Purchase Other Current Assets |
$0 |
$0 |
$0 |
|
Purchase Long-term Assets |
$0 |
$0 |
$0 |
|
Dividends |
$0 |
$0 |
$0 |
|
Subtotal Cash Spent |
$299,063 |
$405,987 |
$544,398 |
|
Net Cash Flow |
($26,808) |
$38,763 |
$162,852 |
|
Cash Balance |
$20,392 |
$59,155 |
$222,007 |
8.6 Projected Balance Sheet
The balance sheet shows that the negative net worth is gradually solved with profits later on. Debts are repaid ahead of schedule.
|
Pro Forma Balance Sheet |
|||
|
Year 1 |
Year 2 |
Year 3 |
|
|
Assets |
|||
|
Current Assets |
|||
|
Cash |
$20,392 |
$59,155 |
$222,007 |
|
Other Current Assets |
$2,000 |
$2,000 |
$2,000 |
|
Total Current Assets |
$22,392 |
$61,155 |
$224,007 |
|
Long-term Assets |
|||
|
Long-term Assets |
$0 |
$0 |
$0 |
|
Accumulated Depreciation |
$0 |
$0 |
$0 |
|
Total Long-term Assets |
$0 |
$0 |
$0 |
|
Total Assets |
$22,392 |
$61,155 |
$224,007 |
|
Liabilities and Capital |
Year 1 |
Year 2 |
Year 3 |
|
Current Liabilities |
|||
|
Accounts Payable |
$10,207 |
$20,207 |
$29,480 |
|
Current Borrowing |
$25,132 |
$0 |
$0 |
|
Other Current Liabilities |
$0 |
$0 |
$0 |
|
Subtotal Current Liabilities |
$35,339 |
$20,207 |
$29,480 |
|
Long-term Liabilities |
$0 |
$0 |
$0 |
|
Total Liabilities |
$35,339 |
$20,207 |
$29,480 |
|
Paid-in Capital |
$25,000 |
$25,000 |
$25,000 |
|
Retained Earnings |
($15,800) |
($37,948) |
$15,948 |
|
Earnings |
($22,148) |
$53,895 |
$153,580 |
|
Total Capital |
($12,948) |
$40,948 |
$194,528 |
|
Total Liabilities and Capital |
$22,392 |
$61,155 |
$224,007 |
|
Net Worth |
($12,948) |
$40,948 |
$194,528 |
8.7 Business Ratios
The following table outlines several important ratios. Standard industry ratios for business seminars are not readily available, but the final column, Industry Profile, details specific ratios based on the Business Start-up Consultancy Services industry as it is classified by the Standard Industry Classification (SIC) code, 8472. The annual ratios for Seminars show steadily improving financial results.
|
Ratio Analysis |
||||
|
Year 1 |
Year 2 |
Year 3 |
Industry Profile |
|
|
Sales Growth |
0.00% |
72.88% |
59.02% |
8.60% |
|
Percent of Total Assets |
||||
|
Other Current Assets |
8.93% |
3.27% |
0.89% |
46.70% |
|
Total Current Assets |
100.00% |
100.00% |
100.00% |
74.90% |
|
Long-term Assets |
0.00% |
0.00% |
0.00% |
25.10% |
|
Total Assets |
100.00% |
100.00% |
100.00% |
100.00% |
|
Current Liabilities |
157.82% |
33.04% |
13.16% |
42.80% |
|
Long-term Liabilities |
0.00% |
0.00% |
0.00% |
17.20% |
|
Total Liabilities |
157.82% |
33.04% |
13.16% |
60.00% |
|
Net Worth |
-57.82% |
66.96% |
86.84% |
40.00% |
|
Percent of Sales |
||||
|
Sales |
100.00% |
100.00% |
100.00% |
100.00% |
|
Gross Margin |
60.92% |
71.28% |
76.32% |
0.00% |
|
Selling, General & Administrative Expenses |
69.53% |
59.16% |
54.60% |
83.50% |
|
Advertising Expenses |
5.83% |
5.62% |
5.66% |
1.20% |
|
Profit Before Interest and Taxes |
-7.18% |
17.59% |
31.02% |
2.60% |
|
Main Ratios |
||||
|
Current |
0.63 |
3.03 |
7.60 |
1.59 |
|
Quick |
0.63 |
3.03 |
7.60 |
1.26 |
|
Total Debt to Total Assets |
157.82% |
33.04% |
13.16% |
60.00% |
|
Pre-tax Return on Net Worth |
171.05% |
188.03% |
112.79% |
4.40% |
|
Pre-tax Return on Assets |
-98.91% |
125.90% |
97.94% |
10.90% |
|
Additional Ratios |
Year 1 |
Year 2 |
Year 3 |
|
|
Net Profit Margin |
-8.61% |
12.12% |
21.72% |
n.a |
|
Return on Equity |
0.00% |
131.62% |
78.95% |
n.a |
|
Activity Ratios |
||||
|
Accounts Payable Turnover |
17.38 |
12.17 |
12.17 |
n.a |
|
Payment Days |
27 |
23 |
25 |
n.a |
|
Total Asset Turnover |
11.49 |
7.27 |
3.16 |
n.a |
|
Debt Ratios |
||||
|
Debt to Net Worth |
0.00 |
0.49 |
0.15 |
n.a |
|
Current Liab. to Liab. |
1.00 |
1.00 |
1.00 |
n.a |
|
Liquidity Ratios |
||||
|
Net Working Capital |
($12,948) |
$40,948 |
$194,528 |
n.a |
|
Interest Coverage |
-5.02 |
62.27 |
342,254,547.03 |
n.a |
|
Additional Ratios |
||||
|
Assets to Sales |
0.09 |
0.14 |
0.32 |
n.a |
|
Current Debt/Total Assets |
158% |
33% |
13% |
n.a |
|
Acid Test |
0.63 |
3.03 |
7.60 |
n.a |
|
Sales/Net Worth |
0.00 |
10.86 |
3.64 |
n.a |
|
Dividend Payout |
0.00 |
0.00 |
0.00 |
n.a |
Appendix
|
Sales Forecast |
|||||||||||||
|
Month 1 |
Month 2 |
Month 3 |
Month 4 |
Month 5 |
Month 6 |
Month 7 |
Month 8 |
Month 9 |
Month 10 |
Month 11 |
Month 12 |
||
|
Unit Sales |
|||||||||||||
|
Corporate Events |
0% |
0 |
1 |
0 |
2 |
0 |
0 |
0 |
0 |
2 |
2 |
0 |
0 |
|
Corporate units |
0% |
0 |
15 |
2 |
30 |
5 |
5 |
5 |
5 |
50 |
60 |
5 |
5 |
|
Standard Events |
0% |
0 |
0 |
1 |
0 |
2 |
2 |
2 |
3 |
3 |
3 |
2 |
1 |
|
Participants |
0% |
0 |
0 |
15 |
0 |
30 |
35 |
35 |
75 |
75 |
75 |
50 |
25 |
|
Other |
0% |
0 |
0 |
0 |
0 |
0 |
0 |
0 |
0 |
0 |
0 |
0 |
0 |
|
Total Unit Sales |
0 |
16 |
18 |
32 |
37 |
42 |
42 |
83 |
130 |
140 |
57 |
31 |
|
|
Unit Prices |
Month 1 |
Month 2 |
Month 3 |
Month 4 |
Month 5 |
Month 6 |
Month 7 |
Month 8 |
Month 9 |
Month 10 |
Month 11 |
Month 12 |
|
|
Corporate Events |
$5,000.00 |
$5,000.00 |
$5,000.00 |
$5,000.00 |
$5,000.00 |
$5,000.00 |
$5,000.00 |
$5,000.00 |
$5,000.00 |
$5,000.00 |
$5,000.00 |
$5,000.00 |
|
|
Corporate units |
$90.00 |
$90.00 |
$90.00 |
$90.00 |
$90.00 |
$90.00 |
$90.00 |
$90.00 |
$90.00 |
$90.00 |
$90.00 |
$90.00 |
|
|
Standard Events |
$0.00 |
$0.00 |
$0.00 |
$0.00 |
$0.00 |
$0.00 |
$0.00 |
$0.00 |
$0.00 |
$0.00 |
$0.00 |
$0.00 |
|
|
Participants |
$495.00 |
$495.00 |
$495.00 |
$495.00 |
$495.00 |
$495.00 |
$495.00 |
$495.00 |
$495.00 |
$495.00 |
$495.00 |
$495.00 |
|
|
Other |
$0.00 |
$0.00 |
$0.00 |
$0.00 |
$0.00 |
$0.00 |
$0.00 |
$0.00 |
$0.00 |
$0.00 |
$0.00 |
$0.00 |
|
|
Sales |
|||||||||||||
|
Corporate Events |
$0 |
$5,000 |
$0 |
$10,000 |
$0 |
$0 |
$0 |
$0 |
$10,000 |
$10,000 |
$0 |
$0 |
|
|
Corporate units |
$0 |
$1,350 |
$180 |
$2,700 |
$450 |
$450 |
$450 |
$450 |
$4,500 |
$5,400 |
$450 |
$450 |
|
|
Standard Events |
$0 |
$0 |
$0 |
$0 |
$0 |
$0 |
$0 |
$0 |
$0 |
$0 |
$0 |
$0 |
|
|
Participants |
$0 |
$0 |
$7,425 |
$0 |
$14,850 |
$17,325 |
$17,325 |
$37,125 |
$37,125 |
$37,125 |
$24,750 |
$12,375 |
|
|
Other |
$0 |
$0 |
$0 |
$0 |
$0 |
$0 |
$0 |
$0 |
$0 |
$0 |
$0 |
$0 |
|
|
Total Sales |
$0 |
$6,350 |
$7,605 |
$12,700 |
$15,300 |
$17,775 |
$17,775 |
$37,575 |
$51,625 |
$52,525 |
$25,200 |
$12,825 |
|
|
Direct Unit Costs |
Month 1 |
Month 2 |
Month 3 |
Month 4 |
Month 5 |
Month 6 |
Month 7 |
Month 8 |
Month 9 |
Month 10 |
Month 11 |
Month 12 |
|
|
Corporate Events |
0.00% |
$500.00 |
$500.00 |
$500.00 |
$500.00 |
$500.00 |
$500.00 |
$500.00 |
$500.00 |
$500.00 |
$500.00 |
$500.00 |
$500.00 |
|
Corporate units |
0.00% |
$75.00 |
$75.00 |
$75.00 |
$75.00 |
$75.00 |
$75.00 |
$75.00 |
$75.00 |
$75.00 |
$75.00 |
$75.00 |
$75.00 |
|
Standard Events |
0.00% |
$2,000.00 |
$2,000.00 |
$2,000.00 |
$2,000.00 |
$2,000.00 |
$2,000.00 |
$2,000.00 |
$2,000.00 |
$2,000.00 |
$2,000.00 |
$2,000.00 |
$2,000.00 |
|
Participants |
0.00% |
$100.00 |
$100.00 |
$100.00 |
$100.00 |
$100.00 |
$100.00 |
$100.00 |
$100.00 |
$100.00 |
$100.00 |
$100.00 |
$100.00 |
|
Other |
0.00% |
$0.00 |
$0.00 |
$0.00 |
$0.00 |
$0.00 |
$0.00 |
$0.00 |
$0.00 |
$0.00 |
$0.00 |
$0.00 |
$0.00 |
|
Direct Cost of Sales |
|||||||||||||
|
Corporate Events |
$0 |
$500 |
$0 |
$1,000 |
$0 |
$0 |
$0 |
$0 |
$1,000 |
$1,000 |
$0 |
$0 |
|
|
Corporate units |
$0 |
$1,125 |
$150 |
$2,250 |
$375 |
$375 |
$375 |
$375 |
$3,750 |
$4,500 |
$375 |
$375 |
|
|
Standard Events |
$0 |
$0 |
$2,000 |
$0 |
$4,000 |
$4,000 |
$4,000 |
$6,000 |
$6,000 |
$6,000 |
$4,000 |
$2,000 |
|
|
Participants |
$0 |
$0 |
$1,500 |
$0 |
$3,000 |
$3,500 |
$3,500 |
$7,500 |
$7,500 |
$7,500 |
$5,000 |
$2,500 |
|
|
Other |
$0 |
$0 |
$0 |
$0 |
$0 |
$0 |
$0 |
$0 |
$0 |
$0 |
$0 |
$0 |
|
|
Subtotal Direct Cost of Sales |
$0 |
$1,625 |
$3,650 |
$3,250 |
$7,375 |
$7,875 |
$7,875 |
$13,875 |
$18,250 |
$19,000 |
$9,375 |
$4,875 |
|
|
Personnel Plan |
|||||||||||||
|
Month 1 |
Month 2 |
Month 3 |
Month 4 |
Month 5 |
Month 6 |
Month 7 |
Month 8 |
Month 9 |
Month 10 |
Month 11 |
Month 12 |
||
|
Owner/founder |
0% |
$3,500 |
$3,500 |
$3,500 |
$3,500 |
$3,500 |
$3,500 |
$3,500 |
$3,500 |
$3,500 |
$3,500 |
$3,500 |
$3,500 |
|
Sales/marketing |
0% |
$3,000 |
$3,000 |
$3,000 |
$3,000 |
$3,000 |
$3,000 |
$3,000 |
$3,000 |
$3,000 |
$3,000 |
$3,000 |
$3,000 |
|
Admin Assistance |
0% |
$2,000 |
$2,000 |
$2,000 |
$2,000 |
$2,000 |
$2,000 |
$2,000 |
$2,000 |
$2,000 |
$2,000 |
$2,000 |
$2,000 |
|
Contractors |
0% |
$0 |
$0 |
$0 |
$0 |
$0 |
$0 |
$0 |
$0 |
$0 |
$0 |
$0 |
$0 |
|
Total People |
3 |
3 |
3 |
3 |
3 |
3 |
3 |
3 |
3 |
3 |
3 |
3 |
|
|
Total Payroll |
$8,500 |
$8,500 |
$8,500 |
$8,500 |
$8,500 |
$8,500 |
$8,500 |
$8,500 |
$8,500 |
$8,500 |
$8,500 |
$8,500 |
|
|
General Assumptions |
|||||||||||||
|
Month 1 |
Month 2 |
Month 3 |
Month 4 |
Month 5 |
Month 6 |
Month 7 |
Month 8 |
Month 9 |
Month 10 |
Month 11 |
Month 12 |
||
|
Plan Month |
1 |
2 |
3 |
4 |
5 |
6 |
7 |
8 |
9 |
10 |
11 |
12 |
|
|
Current Interest Rate |
10.00% |
10.00% |
10.00% |
10.00% |
10.00% |
10.00% |
10.00% |
10.00% |
10.00% |
10.00% |
10.00% |
10.00% |
|
|
Long-term Interest Rate |
10.00% |
10.00% |
10.00% |
10.00% |
10.00% |
10.00% |
10.00% |
10.00% |
10.00% |
10.00% |
10.00% |
10.00% |
|
|
Tax Rate |
30.00% |
30.00% |
30.00% |
30.00% |
30.00% |
30.00% |
30.00% |
30.00% |
30.00% |
30.00% |
30.00% |
30.00% |
|
|
Other |
0 |
0 |
0 |
0 |
0 |
0 |
0 |
0 |
0 |
0 |
0 |
0 |
|
|
Pro Forma Profit and Loss |
|||||||||||||
|
Month 1 |
Month 2 |
Month 3 |
Month 4 |
Month 5 |
Month 6 |
Month 7 |
Month 8 |
Month 9 |
Month 10 |
Month 11 |
Month 12 |
||
|
Sales |
$0 |
$6,350 |
$7,605 |
$12,700 |
$15,300 |
$17,775 |
$17,775 |
$37,575 |
$51,625 |
$52,525 |
$25,200 |
$12,825 |
|
|
Direct Cost of Sales |
$0 |
$1,625 |
$3,650 |
$3,250 |
$7,375 |
$7,875 |
$7,875 |
$13,875 |
$18,250 |
$19,000 |
$9,375 |
$4,875 |
|
|
Other Production Expenses |
$3,000 |
$500 |
$0 |
$0 |
$0 |
$0 |
$0 |
$0 |
$0 |
$0 |
$0 |
$0 |
|
|
Total Cost of Sales |
$3,000 |
$2,125 |
$3,650 |
$3,250 |
$7,375 |
$7,875 |
$7,875 |
$13,875 |
$18,250 |
$19,000 |
$9,375 |
$4,875 |
|
|
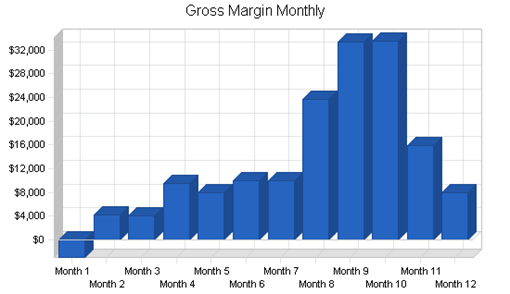
Gross Margin |
($3,000) |
$4,225 |
$3,955 |
$9,450 |
$7,925 |
$9,900 |
$9,900 |
$23,700 |
$33,375 |
$33,525 |
$15,825 |
$7,950 |
|
|
Gross Margin % |
0.00% |
66.54% |
52.01% |
74.41% |
51.80% |
55.70% |
55.70% |
63.07% |
64.65% |
63.83% |
62.80% |
61.99% |
|
|
Expenses |
|||||||||||||
|
Payroll |
$8,500 |
$8,500 |
$8,500 |
$8,500 |
$8,500 |
$8,500 |
$8,500 |
$8,500 |
$8,500 |
$8,500 |
$8,500 |
$8,500 |
|
|
Sales and Marketing and Other Expenses |
$6,000 |
$8,000 |
$3,500 |
$3,500 |
$3,500 |
$3,500 |
$3,500 |
$3,500 |
$3,500 |
$3,500 |
$3,500 |
$3,500 |
|
|
Depreciation |
$0 |
$0 |
$0 |
$0 |
$0 |
$0 |
$0 |
$0 |
$0 |
$0 |
$0 |
$0 |
|
|
Utilities |
$200 |
$200 |
$200 |
$200 |
$200 |
$200 |
$200 |
$200 |
$200 |
$200 |
$200 |
$200 |
|
|
Insurance |
$500 |
$0 |
$0 |
$0 |
$0 |
$0 |
$0 |
$0 |
$0 |
$0 |
$0 |
$0 |
|
|
Rent |
$500 |
$500 |
$500 |
$500 |
$500 |
$500 |
$500 |
$500 |
$500 |
$500 |
$500 |
$500 |
|
|
Payroll Taxes |
15% |
$1,275 |
$1,275 |
$1,275 |
$1,275 |
$1,275 |
$1,275 |
$1,275 |
$1,275 |
$1,275 |
$1,275 |
$1,275 |
$1,275 |
|
Other |
$0 |
$0 |
$0 |
$0 |
$0 |
$0 |
$0 |
$0 |
$0 |
$0 |
$0 |
$0 |
|
|
Total Operating Expenses |
$16,975 |
$18,475 |
$13,975 |
$13,975 |
$13,975 |
$13,975 |
$13,975 |
$13,975 |
$13,975 |
$13,975 |
$13,975 |
$13,975 |
|
|
Profit Before Interest and Taxes |
($19,975) |
($14,250) |
($10,020) |
($4,525) |
($6,050) |
($4,075) |
($4,075) |
$9,725 |
$19,400 |
$19,550 |
$1,850 |
($6,025) |
|
|
EBITDA |
($19,975) |
($14,250) |
($10,020) |
($4,525) |
($6,050) |
($4,075) |
($4,075) |
$9,725 |
$19,400 |
$19,550 |
$1,850 |
($6,025) |
|
|
Interest Expense |
$247 |
$244 |
$303 |
$362 |
$359 |
$355 |
$352 |
$348 |
$345 |
$341 |
$213 |
$209 |
|
|
Taxes Incurred |
$0 |
$0 |
$0 |
$0 |
$0 |
$0 |
$0 |
$0 |
$0 |
$0 |
$0 |
$0 |
|
|
Net Profit |
($20,222) |
($14,494) |
($10,323) |
($4,887) |
($6,409) |
($4,430) |
($4,427) |
$9,377 |
$19,055 |
$19,209 |
$1,637 |
($6,234) |
|
|
Net Profit/Sales |
0.00% |
-228.24% |
-135.74% |
-38.48% |
-41.89% |
-24.92% |
-24.90% |
24.95% |
36.91% |
36.57% |
6.50% |
-48.61% |
|
|
Pro Forma Cash Flow |
|||||||||||||
|
Month 1 |
Month 2 |
Month 3 |
Month 4 |
Month 5 |
Month 6 |
Month 7 |
Month 8 |
Month 9 |
Month 10 |
Month 11 |
Month 12 |
||
|
Cash Received |
|||||||||||||
|
Cash from Operations |
|||||||||||||
|
Cash Sales |
$0 |
$6,350 |
$7,605 |
$12,700 |
$15,300 |
$17,775 |
$17,775 |
$37,575 |
$51,625 |
$52,525 |
$25,200 |
$12,825 |
|
|
Subtotal Cash from Operations |
$0 |
$6,350 |
$7,605 |
$12,700 |
$15,300 |
$17,775 |
$17,775 |
$37,575 |
$51,625 |
$52,525 |
$25,200 |
$12,825 |
|
|
Additional Cash Received |
|||||||||||||
|
Sales Tax, VAT, HST/GST Received |
0.00% |
$0 |
$0 |
$0 |
$0 |
$0 |
$0 |
$0 |
$0 |
$0 |
$0 |
$0 |
$0 |
|
New Current Borrowing |
$0 |
$0 |
$7,500 |
$7,500 |
$0 |
$0 |
$0 |
$0 |
$0 |
$0 |
$0 |
$0 |
|
|
New Other Liabilities (interest-free) |
$0 |
$0 |
$0 |
$0 |
$0 |
$0 |
$0 |
$0 |
$0 |
$0 |
$0 |
$0 |
|
|
New Long-term Liabilities |
$0 |
$0 |
$0 |
$0 |
$0 |
$0 |
$0 |
$0 |
$0 |
$0 |
$0 |
$0 |
|
|
Sales of Other Current Assets |
$0 |
$0 |
$0 |
$0 |
$0 |
$0 |
$0 |
$0 |
$0 |
$0 |
$0 |
$0 |
|
|
Sales of Long-term Assets |
$0 |
$0 |
$0 |
$0 |
$0 |
$0 |
$0 |
$0 |
$0 |
$0 |
$0 |
$0 |
|
|
New Investment Received |
$0 |
$0 |
$0 |
$0 |
$0 |
$0 |
$0 |
$0 |
$0 |
$0 |
$0 |
$0 |
|
|
Subtotal Cash Received |
$0 |
$6,350 |
$15,105 |
$20,200 |
$15,300 |
$17,775 |
$17,775 |
$37,575 |
$51,625 |
$52,525 |
$25,200 |
$12,825 |
|
|
Expenditures |
Month 1 |
Month 2 |
Month 3 |
Month 4 |
Month 5 |
Month 6 |
Month 7 |
Month 8 |
Month 9 |
Month 10 |
Month 11 |
Month 12 |
|
|
Expenditures from Operations |
|||||||||||||
|
Cash Spending |
$8,500 |
$8,500 |
$8,500 |
$8,500 |
$8,500 |
$8,500 |
$8,500 |
$8,500 |
$8,500 |
$8,500 |
$8,500 |
$8,500 |
|
|
Bill Payments |
$391 |
$11,742 |
$12,246 |
$9,416 |
$9,224 |
$13,225 |
$13,705 |
$13,902 |
$19,844 |
$24,095 |
$24,491 |
$14,913 |
|
|
Subtotal Spent on Operations |
$8,891 |
$20,242 |
$20,746 |
$17,916 |
$17,724 |
$21,725 |
$22,205 |
$22,402 |
$28,344 |
$32,595 |
$32,991 |
$23,413 |
|
|
Additional Cash Spent |
|||||||||||||
|
Sales Tax, VAT, HST/GST Paid Out |
$0 |
$0 |
$0 |
$0 |
$0 |
$0 |
$0 |
$0 |
$0 |
$0 |
$0 |
$0 |
|
|
Principal Repayment of Current Borrowing |
$387 |
$391 |
$394 |
$397 |
$400 |
$404 |
$407 |
$411 |
$414 |
$417 |
$15,421 |
$424 |
|
|
Other Liabilities Principal Repayment |
$0 |
$0 |
$0 |
$0 |
$0 |
$0 |
$0 |
$0 |
$0 |
$0 |
$0 |
$10,000 |
|
|
Long-term Liabilities Principal Repayment |
$0 |
$0 |
$0 |
$0 |
$0 |
$0 |
$0 |
$0 |
$0 |
$0 |
$0 |
$0 |
|
|
Purchase Other Current Assets |
$0 |
$0 |
$0 |
$0 |
$0 |
$0 |
$0 |
$0 |
$0 |
$0 |
$0 |
$0 |
|
|
Purchase Long-term Assets |
$0 |
$0 |
$0 |
$0 |
$0 |
$0 |
$0 |
$0 |
$0 |
$0 |
$0 |
$0 |
|
|
Dividends |
$0 |
$0 |
$0 |
$0 |
$0 |
$0 |
$0 |
$0 |
$0 |
$0 |
$0 |
$0 |
|
|
Subtotal Cash Spent |
$9,278 |
$20,633 |
$21,140 |
$18,314 |
$18,125 |
$22,129 |
$22,612 |
$22,812 |
$28,758 |
$33,012 |
$48,412 |
$33,837 |
|
|
Net Cash Flow |
($9,278) |
($14,283) |
($6,035) |
$1,886 |
($2,825) |
($4,354) |
($4,837) |
$14,763 |
$22,867 |
$19,513 |
($23,212) |
($21,012) |
|
|
Cash Balance |
$37,922 |
$23,639 |
$17,604 |
$19,490 |
$16,665 |
$12,311 |
$7,474 |
$22,237 |
$45,103 |
$64,616 |
$41,404 |
$20,392 |
|
|
Pro Forma Balance Sheet |
|||||||||||||
|
Month 1 |
Month 2 |
Month 3 |
Month 4 |
Month 5 |
Month 6 |
Month 7 |
Month 8 |
Month 9 |
Month 10 |
Month 11 |
Month 12 |
||
|
Assets |
Starting Balances |
||||||||||||
|
Current Assets |
|||||||||||||
|
Cash |
$47,200 |
$37,922 |
$23,639 |
$17,604 |
$19,490 |
$16,665 |
$12,311 |
$7,474 |
$22,237 |
$45,103 |
$64,616 |
$41,404 |
$20,392 |
|
Other Current Assets |
$2,000 |
$2,000 |
$2,000 |
$2,000 |
$2,000 |
$2,000 |
$2,000 |
$2,000 |
$2,000 |
$2,000 |
$2,000 |
$2,000 |
$2,000 |
|
Total Current Assets |
$49,200 |
$39,922 |
$25,639 |
$19,604 |
$21,490 |
$18,665 |
$14,311 |
$9,474 |
$24,237 |
$47,103 |
$66,616 |
$43,404 |
$22,392 |
|
Long-term Assets |
|||||||||||||
|
Long-term Assets |
$0 |
$0 |
$0 |
$0 |
$0 |
$0 |
$0 |
$0 |
$0 |
$0 |
$0 |
$0 |
$0 |
|
Accumulated Depreciation |
$0 |
$0 |
$0 |
$0 |
$0 |
$0 |
$0 |
$0 |
$0 |
$0 |
$0 |
$0 |
$0 |
|
Total Long-term Assets |
$0 |
$0 |
$0 |
$0 |
$0 |
$0 |
$0 |
$0 |
$0 |
$0 |
$0 |
$0 |
$0 |
|
Total Assets |
$49,200 |
$39,922 |
$25,639 |
$19,604 |
$21,490 |
$18,665 |
$14,311 |
$9,474 |
$24,237 |
$47,103 |
$66,616 |
$43,404 |
$22,392 |
|
Liabilities and Capital |
Month 1 |
Month 2 |
Month 3 |
Month 4 |
Month 5 |
Month 6 |
Month 7 |
Month 8 |
Month 9 |
Month 10 |
Month 11 |
Month 12 |
|
|
Current Liabilities |
|||||||||||||
|
Accounts Payable |
$0 |
$11,331 |
$11,932 |
$9,113 |
$8,784 |
$12,768 |
$13,248 |
$13,245 |
$19,042 |
$23,268 |
$23,989 |
$14,561 |
$10,207 |
|
Current Borrowing |
$30,000 |
$29,613 |
$29,222 |
$36,328 |
$43,431 |
$43,030 |
$42,627 |
$42,219 |
$41,809 |
$41,395 |
$40,977 |
$25,556 |
$25,132 |
|
Other Current Liabilities |
$10,000 |
$10,000 |
$10,000 |
$10,000 |
$10,000 |
$10,000 |
$10,000 |
$10,000 |
$10,000 |
$10,000 |
$10,000 |
$10,000 |
$0 |
|
Subtotal Current Liabilities |
$40,000 |
$50,944 |
$51,154 |
$55,442 |
$62,215 |
$65,799 |
$65,875 |
$65,464 |
$70,851 |
$74,662 |
$74,967 |
$50,117 |
$35,339 |
|
Long-term Liabilities |
$0 |
$0 |
$0 |
$0 |
$0 |
$0 |
$0 |
$0 |
$0 |
$0 |
$0 |
$0 |
$0 |
|
Total Liabilities |
$40,000 |
$50,944 |
$51,154 |
$55,442 |
$62,215 |
$65,799 |
$65,875 |
$65,464 |
$70,851 |
$74,662 |
$74,967 |
$50,117 |
$35,339 |
|
Paid-in Capital |
$25,000 |
$25,000 |
$25,000 |
$25,000 |
$25,000 |
$25,000 |
$25,000 |
$25,000 |
$25,000 |
$25,000 |
$25,000 |
$25,000 |
$25,000 |
|
Retained Earnings |
($15,800) |
($15,800) |
($15,800) |
($15,800) |
($15,800) |
($15,800) |
($15,800) |
($15,800) |
($15,800) |
($15,800) |
($15,800) |
($15,800) |
($15,800) |
|
Earnings |
$0 |
($20,222) |
($34,715) |
($45,038) |
($49,925) |
($56,334) |
($60,764) |
($65,191) |
($55,814) |
($36,759) |
($17,550) |
($15,913) |
($22,148) |
|
Total Capital |
$9,200 |
($11,022) |
($25,515) |
($35,838) |
($40,725) |
($47,134) |
($51,564) |
($55,991) |
($46,614) |
($27,559) |
($8,350) |
($6,713) |
($12,948) |
|
Total Liabilities and Capital |
$49,200 |
$39,922 |
$25,639 |
$19,604 |
$21,490 |
$18,665 |
$14,311 |
$9,474 |
$24,237 |
$47,103 |
$66,616 |
$43,404 |
$22,392 |
|
Net Worth |
$9,200 |
($11,022) |
($25,515) |
($35,838) |
($40,725) |
($47,134) |
($51,564) |
($55,991) |
($46,614) |
($27,559) |
($8,350) |
($6,713) |
($12,948) |