Educational Software K-12 Business Plan
Curriculum Companion Suites
Executive Summary
Introduction
Curriculum Companion Suites (CSS) is a medium-sized
software development and consulting firm focused on making the educational
process more efficient and effective for K-12 schools. CCS software serves
as a virtual teaching assistant for the educational process. Students can
follow along with curriculum electronically through a central computer terminal
at the front of the classroom.
The Company
CCS keys to success are the company's commitment to market awareness and future
potential direction of the educational process, and CCS' relationships with a
large number of educational institutions and districts.
Curriculum Companion Suites is a start-up company comprised of six executives and seventy-six employees. The executives represent all functional areas, with 70 years of combined experience in the software development industry. Two majority shareholders, Andrew Christiansen and David Fields, own 80% of the company. Other investors own a minority stake. At the moment, the company does not have plans for going public, as most of the financing is raised internally. CSS is incorporated in the state of Oregon by the two majority shareholders.
Products
CCS offers a suite of educational software for each
grade level, from kindergarten through 12th grade. These suites are developed
in collaboration with major curriculum publishers with whom CCS has established
strategic partnerships.
CCS provides full installation, initial and ongoing consulting support. These services are provided as part of each software package purchase.
The Market
The competitive marketplace includes only a handful of direct competitors
within the learning information systems vendors segment, providing software
products and installation and systems integration services to kindergarten
through senior high (K-12) schools in the United States. CCS competes primarily
against more traditional methods of education, training and testing, including
pencil and paper testing. In addition, CCS competes with other companies
offering educational software products to schools, such as International
Business Machines Corporation, Apple Computer, Inc., and Mattel, Inc.
Educational institutions and school districts have not been active in searching out technical enhancements to the educational process. Rather, companies such as CCS have often utilized a more "push" type of marketing strategy. The educational community has had to be "educated" themselves on the opportunities of utilizing technical infrastructures to enhance learning processes.
Since only a handful of other companies are competing directly with CCS in this market, the company plans to develop a healthy level of market share, with a goal of 10% at the end of three years.
The target market for CCS is the urban/metropolitan educational market, as this market presents the highest level of opportunity in terms of revenues. Additionally, software installations and customizations in this market are much more feasible in terms of technical logistics and efficiencies. Thus, profitability is by far more likely in this market.
Relationships have been established with a large number of educational institutions and school districts across the U.S. Significant investments have been made by CCS to research and understand the specific needs and potential enhancements to the current educational process.
Financial Considerations
CCS expects to raise a substantial amount of owner capital, and
borrow a comparable amount in a guaranteed SBA 10-year loan. This
provides the bulk of the current financing required.
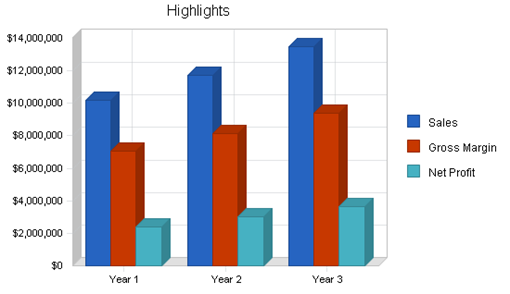
CCS intends to deliver generous sales in the first year, with steady grown in the second and third years of the plan.
1.1 Mission
Curriculum Companion Suites aims to offer software curriculum suites to K-12 schools within the U.S. market. CCS will focus on providing solutions to enhance the educational capabilities of schools.
1.2 Keys to Success
CCS keys to success include:
- The company's commitment to being keenly alert to the current educational environment and future potential direction of the educational process.
- CCS' relationships with a large number of educational institutions and districts.
Company Summary
Curriculum Companion Suites is a start-up comprised of six executives. These executives represent all functional areas, with 70 years of combined experience in the software development industry. Two majority shareholders, Andrew Christiansen and David Fields, own 80% of the company. The bulk of outside financing will come from a 10-year Small Business Administration (SBA) loan.
2.1 Company Ownership
CSS is incorporated in the state of Oregon by Andrew Christiansen and David Fields. Other investors own a minority stake. At the moment, the company does not have plans for going public, as most of the financing is raised internally.
CSS is a start-up company that was registered in the year 2000.
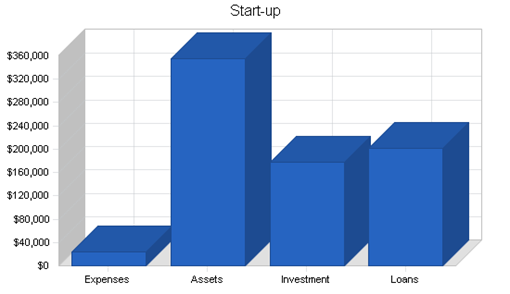
2.2 Start-up Summary
Of the total start-up expenses, the lion's share has been spent on software licenses. Estimated start-up cash requirements should be sufficient to cover ongoing expenses in the first months of operation. Christiansen and Fields have each invested heavily, with the rest of investment coming from minority shareholders. The company has also secured a 10-year SBA loan and a one-year loan from its bank. Following is a chart and table summarizing projected initial start-up costs.
|
Start-up Requirements |
|
|
Start-up Expenses |
|
|
Legal |
$3,000 |
|
Software Licenses |
$20,000 |
|
Other |
$1,000 |
|
Total Start-up Expenses |
$24,000 |
|
Start-up Assets |
|
|
Cash Required |
$180,000 |
|
Other Current Assets |
$75,000 |
|
Long-term Assets |
$100,000 |
|
Total Assets |
$355,000 |
|
Total Requirements |
$379,000 |
|
Start-up Funding |
|
|
Start-up Expenses to Fund |
$24,000 |
|
Start-up Assets to Fund |
$355,000 |
|
Total Funding Required |
$379,000 |
|
Assets |
|
|
Non-cash Assets from Start-up |
$175,000 |
|
Cash Requirements from Start-up |
$180,000 |
|
Additional Cash Raised |
$0 |
|
Cash Balance on Starting Date |
$180,000 |
|
Total Assets |
$355,000 |
|
Liabilities and Capital |
|
|
Liabilities |
|
|
Current Borrowing |
$50,000 |
|
Long-term Liabilities |
$150,000 |
|
Accounts Payable (Outstanding Bills) |
$1,000 |
|
Other Current Liabilities (interest-free) |
$0 |
|
Total Liabilities |
$201,000 |
|
Capital |
|
|
Planned Investment |
|
|
Andrew Christiansen |
$60,000 |
|
David Fields |
$60,000 |
|
Other |
$58,000 |
|
Additional Investment Requirement |
$0 |
|
Total Planned Investment |
$178,000 |
|
Loss at Start-up (Start-up Expenses) |
($24,000) |
|
Total Capital |
$154,000 |
|
Total Capital and Liabilities |
$355,000 |
|
Total Funding |
$379,000 |
Service Description
CCS offers a suite of educational software for each grade level, from Kindergarten through 12th grade. These suites are developed in collaboration with major curriculum publishers with whom CCS has established strategic partnerships.
CCS provides full installation, initial, and ongoing consulting support. These services are provided as part of each software package purchase.
Market Analysis Summary
CCS has a focus on K-12 schools within the U.S. market, especially schools who:
- already own educational packages from large curriculum publishers who are CCS strategic partners
- owns software that has been recently developed by CSS.
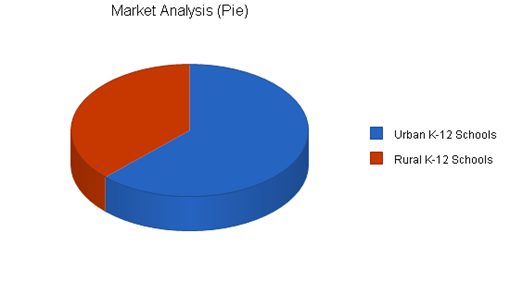
The following chart and table summarize the total market potential for CSS products.
|
Market Analysis |
|||||||
|
Year 1 |
Year 2 |
Year 3 |
Year 4 |
Year 5 |
|||
|
Potential Customers |
Growth |
CAGR |
|||||
|
Urban K-12 Schools |
5% |
2,500 |
2,625 |
2,756 |
2,894 |
3,039 |
5.00% |
|
Rural K-12 Schools |
5% |
1,500 |
1,575 |
1,654 |
1,737 |
1,824 |
5.01% |
|
Total |
5.01% |
4,000 |
4,200 |
4,410 |
4,631 |
4,863 |
5.01% |
4.1 Market Segmentation
Metropolitan Schools
Metropolitan schools often have larger student populations, with more classes, requiring more extensive and comprehensive software packages. The installations are consequently more extensive in nature.
Rural Schools
Rural schools often have relatively smaller student populations, and fewer classes. Additional customization during installations is usually necessary, as the infrastructure for computer networks is either substandard or nonexistent.
4.2 Target Market Segment Strategy
The target market for CCS is the urban/metropolitan educational market, as this market presents the highest level of opportunity in terms of revenues. Additionally, software installations and customizations in this market are much more feasible in terms of technical logistics and efficiencies. Thus, profitability is by far more likely in this market.
Relationships have been established with a large number of educational institutions and school districts across the U.S. Significant investments have been made by CCS to research and understand the specific needs and potential enhancements to the current educational process. By working closely with educational administrators in efforts to optimize the educational process, strong relationships have been established and a high sales closing rate has resulted.
4.3 Market Needs
CCS's research has found that educators, as well as parents of K-12 children believe that the educational process is in need of significant improvements. Children, for the most part, have been found to strongly prefer an educational environment where they can learn "hands on" using the computer in conjunction with teacher facilitation, as opposed to teacher facilitation only.
4.4 Service Business Analysis
Major competition to CSS comes not from other software developers but from traditional book publishers. In fact, one of the goals of the company is to educate its clientele about the possibilities and features of the specially-designed software that assists in the educational process. The tool CSS provides teachers with will help them become more effective and efficient in classrooms. The company believes that the novelty and added value its products provide to educators will be key buying decision criteria for the customers.
4.5 Competition and Buying Patterns
Only a handful of other companies are competing directly with CCS in this market. CCS plans to develop a healthy level of market share, with a goal of 10% at the end of three years. With the exponential increase in computer and Internet usage among the public in the last five years, this is a relatively new market. CCS has taken a lead primarily due to its intense efforts both in research and development, as well as in establishing relationships in the educational community.
Educational institutions and school districts have not been active in searching out technical enhancements to the educational process. Rather, companies such as CCS have often utilized a more "push" type of marketing strategy. The educational community has had to be "educated" themselves on the opportunities of utilizing technical infrastructures to enhance learning processes.
The competitive marketplace includes only a handful of direct competitors within the learning information systems vendors segment, providing software products and installation and systems integration services to kindergarten through senior high (K-12) schools in the United States. Typical learning information systems consist of computer software and related training designed to improve student academic performance by increasing the quality, quantity, and timeliness of performance data available to educators and by facilitating increased student practice of essential skills.
There are a number of competing products covering a wide range of educational requirements. These include:
- Accelerated reading products--software for motivating and monitoring increased literature-based reading practice.
- Accelerated math--software aimed to increase a student's competency across this discipline utilizing the latest techniques.
- Professional development training for educators.
- Test-generation software.
Software products offered by competitors also aim to improve student academic performance by intensifying skills practice and increasing the quality, quantity and timeliness of information available to educators.
CCS competes primarily against more traditional methods of education, training and testing, including pencil and paper testing. In addition, CCS competes with other companies offering educational software products to schools, such as International Business Machines Corporation, Apple Computer, Inc., and Mattel, Inc. Many other companies, including Microsoft Corporation and Walt Disney Company, provide educational software products.
Strategy and Implementation Summary
CCS intends to succeed by offering K-12 schools a technological tool to assist teachers in making the educational process more efficient and effective.
5.1 Competitive Edge
CCS' competitive edge is its new ideas and first to market technologies.
5.2 Sales Strategy
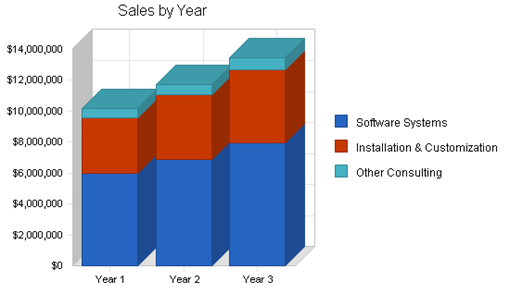
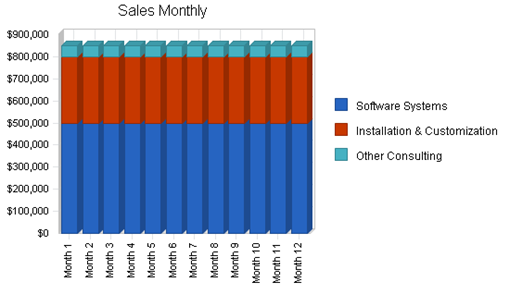
The table and charts shows the level of sales CCS intends to deliver in the first year through the third year of the plan. Detailed monthly sales for the first year are in the appendix.
|
Sales Forecast |
|||
|
Year 1 |
Year 2 |
Year 3 |
|
|
Unit Sales |
|||
|
Software Systems |
240 |
276 |
317 |
|
Installation & Customization |
240 |
276 |
317 |
|
Other Consulting |
120 |
138 |
159 |
|
Total Unit Sales |
600 |
690 |
794 |
|
Unit Prices |
Year 1 |
Year 2 |
Year 3 |
|
Software Systems |
$25,000.00 |
$25,000.00 |
$25,000.00 |
|
Installation & Customization |
$15,000.00 |
$15,000.00 |
$15,000.00 |
|
Other Consulting |
$5,000.00 |
$5,000.00 |
$5,000.00 |
|
Sales |
|||
|
Software Systems |
$6,000,000 |
$6,900,000 |
$7,935,000 |
|
Installation & Customization |
$3,600,000 |
$4,140,000 |
$4,761,000 |
|
Other Consulting |
$600,000 |
$690,000 |
$793,500 |
|
Total Sales |
$10,200,000 |
$11,730,000 |
$13,489,500 |
|
Direct Unit Costs |
Year 1 |
Year 2 |
Year 3 |
|
Software Systems |
$2,000.00 |
$2,000.00 |
$2,000.00 |
|
Installation & Customization |
$10,000.00 |
$10,000.00 |
$10,000.00 |
|
Other Consulting |
$2,000.00 |
$2,000.00 |
$2,000.00 |
|
Direct Cost of Sales |
|||
|
Software Systems |
$480,000 |
$552,000 |
$634,800 |
|
Installation & Customization |
$2,400,000 |
$2,760,000 |
$3,174,000 |
|
Other Consulting |
$240,000 |
$276,000 |
$317,400 |
|
Subtotal Direct Cost of Sales |
$3,120,000 |
$3,588,000 |
$4,126,200 |
Management Summary
Andrew B. Christiansen has extensive experience in business planning and finance, including tenures as chief financial officer with ABC Conglomerate and DEF International. David E. Fields brings in experience in the area of marketing, advertising, and communications.
6.1 Personnel Plan
CSS will focus on strong product development and marketing. These are the areas where most of the investments and training will go. The table below, and in the appendix, outlines the company's personnel plan for the next years.
|
Personnel Plan |
|||
|
Year 1 |
Year 2 |
Year 3 |
|
|
Product Development |
$900,000 |
$945,000 |
$992,250 |
|
Installation Technicians |
$875,000 |
$918,750 |
$964,688 |
|
Administrative |
$595,000 |
$624,750 |
$655,988 |
|
Sales & Marketing |
$900,000 |
$945,000 |
$992,250 |
|
Other |
$0 |
$0 |
$0 |
|
Total People |
82 |
86 |
90 |
|
Total Payroll |
$3,270,000 |
$3,433,500 |
$3,605,175 |
Financial Plan
CCS expects to raise its own capital, and to acquire a guaranteed the SBA 10-year loan. This provides the bulk of the current financing required.
7.1 Break-even Analysis
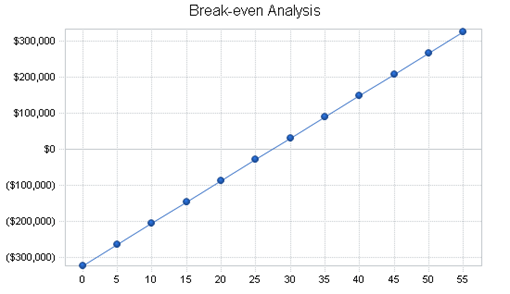
CCS's Break-even Analysis is based on the average of the first-year figures for total sales by units, and by operating expenses. These are presented as per-unit revenue, per-unit cost, and fixed costs. These conservative assumptions make for a more accurate estimate of real risk.
|
Break-even Analysis |
|
|
Monthly Units Break-even |
27 |
|
Monthly Revenue Break-even |
$466,023 |
|
Assumptions: |
|
|
Average Per-Unit Revenue |
$17,000.00 |
|
Average Per-Unit Variable Cost |
$5,200.00 |
|
Estimated Monthly Fixed Cost |
$323,475 |
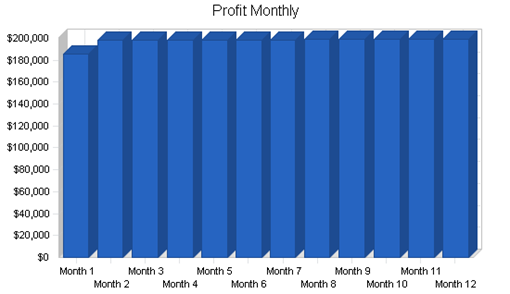
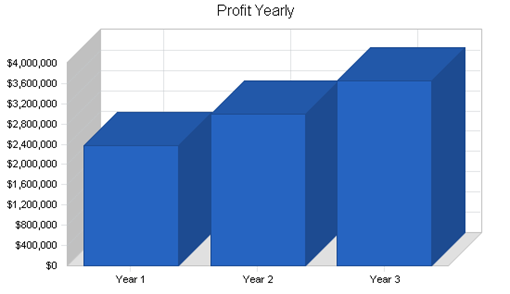
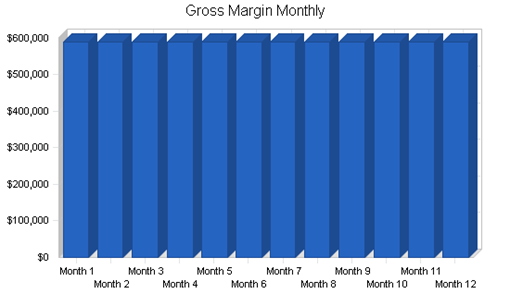
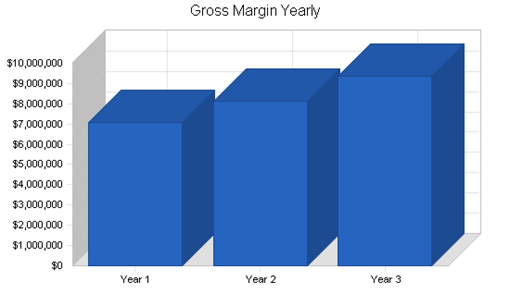
7.2 Projected Profit and Loss
The projected Profit and Loss for CCS is presented in the accompanying table. The three yearly totals are shown here, with year one monthlies in the appendix.
|
Pro Forma Profit and Loss |
|||
|
Year 1 |
Year 2 |
Year 3 |
|
|
Sales |
$10,200,000 |
$11,730,000 |
$13,489,500 |
|
Direct Cost of Sales |
$3,120,000 |
$3,588,000 |
$4,126,200 |
|
Other |
$0 |
$0 |
$0 |
|
Total Cost of Sales |
$3,120,000 |
$3,588,000 |
$4,126,200 |
|
Gross Margin |
$7,080,000 |
$8,142,000 |
$9,363,300 |
|
Gross Margin % |
69.41% |
69.41% |
69.41% |
|
Expenses |
|||
|
Payroll |
$3,270,000 |
$3,433,500 |
$3,605,175 |
|
Sales and Marketing and Other Expenses |
$96,000 |
$150,000 |
$265,000 |
|
Depreciation |
$24,000 |
$27,600 |
$31,740 |
|
Utilities |
$1,200 |
$1,500 |
$1,700 |
|
Payroll Taxes |
$490,500 |
$515,025 |
$540,776 |
|
Other |
$0 |
$0 |
$0 |
|
Total Operating Expenses |
$3,881,700 |
$4,127,625 |
$4,444,391 |
|
Profit Before Interest and Taxes |
$3,198,300 |
$4,014,375 |
$4,918,909 |
|
EBITDA |
$3,222,300 |
$4,041,975 |
$4,950,649 |
|
Interest Expense |
$18,700 |
$16,400 |
$14,000 |
|
Taxes Incurred |
$808,144 |
$999,494 |
$1,246,664 |
|
Net Profit |
$2,371,456 |
$2,998,481 |
$3,658,244 |
|
Net Profit/Sales |
23.25% |
25.56% |
27.12% |
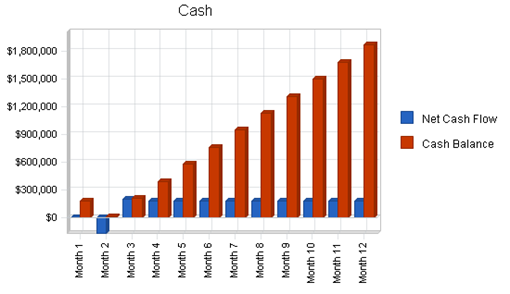
7.3 Projected Cash Flow
The cash flow projection shows that provisions for ongoing expenses are adequate to meet CCS's needs as the business generates cash flow sufficient to support operations.
|
Pro Forma Cash Flow |
|||
|
Year 1 |
Year 2 |
Year 3 |
|
|
Cash Received |
|||
|
Cash from Operations |
|||
|
Cash Sales |
$3,468,000 |
$3,988,200 |
$4,586,430 |
|
Cash from Receivables |
$5,628,700 |
$7,576,305 |
$8,712,751 |
|
Subtotal Cash from Operations |
$9,096,700 |
$11,564,505 |
$13,299,181 |
|
Additional Cash Received |
|||
|
Sales Tax, VAT, HST/GST Received |
$0 |
$0 |
$0 |
|
New Current Borrowing |
$0 |
$0 |
$0 |
|
New Other Liabilities (interest-free) |
$0 |
$0 |
$0 |
|
New Long-term Liabilities |
$0 |
$0 |
$0 |
|
Sales of Other Current Assets |
$0 |
$0 |
$0 |
|
Sales of Long-term Assets |
$0 |
$0 |
$0 |
|
New Investment Received |
$190,000 |
$0 |
$0 |
|
Subtotal Cash Received |
$9,286,700 |
$11,564,505 |
$13,299,181 |
|
Expenditures |
Year 1 |
Year 2 |
Year 3 |
|
Expenditures from Operations |
|||
|
Cash Spending |
$3,270,000 |
$3,433,500 |
$3,605,175 |
|
Bill Payments |
$4,171,394 |
$5,201,383 |
$6,118,402 |
|
Subtotal Spent on Operations |
$7,441,394 |
$8,634,883 |
$9,723,577 |
|
Additional Cash Spent |
|||
|
Sales Tax, VAT, HST/GST Paid Out |
$0 |
$0 |
$0 |
|
Principal Repayment of Current Borrowing |
$12,000 |
$12,000 |
$12,000 |
|
Other Liabilities Principal Repayment |
$0 |
$0 |
$0 |
|
Long-term Liabilities Principal Repayment |
$12,000 |
$12,000 |
$12,000 |
|
Purchase Other Current Assets |
$0 |
$0 |
$0 |
|
Purchase Long-term Assets |
$135,000 |
$225,000 |
$295,000 |
|
Dividends |
$0 |
$0 |
$0 |
|
Subtotal Cash Spent |
$7,600,394 |
$8,883,883 |
$10,042,577 |
|
Net Cash Flow |
$1,686,306 |
$2,680,622 |
$3,256,604 |
|
Cash Balance |
$1,866,306 |
$4,546,928 |
$7,803,532 |
7.4 Projected Balance Sheet
Following is the projected Balance Sheet for CCS. Again, three years of annuals are shown below, with first year monthlies in the appendix.
|
Pro Forma Balance Sheet |
|||
|
Year 1 |
Year 2 |
Year 3 |
|
|
Assets |
|||
|
Current Assets |
|||
|
Cash |
$1,866,306 |
$4,546,928 |
$7,803,532 |
|
Accounts Receivable |
$1,103,300 |
$1,268,795 |
$1,459,114 |
|
Other Current Assets |
$75,000 |
$75,000 |
$75,000 |
|
Total Current Assets |
$3,044,606 |
$5,890,723 |
$9,337,646 |
|
Long-term Assets |
|||
|
Long-term Assets |
$235,000 |
$460,000 |
$755,000 |
|
Accumulated Depreciation |
$24,000 |
$51,600 |
$83,340 |
|
Total Long-term Assets |
$211,000 |
$408,400 |
$671,660 |
|
Total Assets |
$3,255,606 |
$6,299,123 |
$10,009,306 |
|
Liabilities and Capital |
Year 1 |
Year 2 |
Year 3 |
|
Current Liabilities |
|||
|
Accounts Payable |
$364,149 |
$433,185 |
$509,124 |
|
Current Borrowing |
$38,000 |
$26,000 |
$14,000 |
|
Other Current Liabilities |
$0 |
$0 |
$0 |
|
Subtotal Current Liabilities |
$402,149 |
$459,185 |
$523,124 |
|
Long-term Liabilities |
$138,000 |
$126,000 |
$114,000 |
|
Total Liabilities |
$540,149 |
$585,185 |
$637,124 |
|
Paid-in Capital |
$368,000 |
$368,000 |
$368,000 |
|
Retained Earnings |
($24,000) |
$2,347,456 |
$5,345,938 |
|
Earnings |
$2,371,456 |
$2,998,481 |
$3,658,244 |
|
Total Capital |
$2,715,456 |
$5,713,938 |
$9,372,182 |
|
Total Liabilities and Capital |
$3,255,606 |
$6,299,123 |
$10,009,306 |
|
Net Worth |
$2,715,456 |
$5,713,938 |
$9,372,182 |
7.5 Business Ratios
The following table represents business ratios for the educational support software industry. These numbers are determined by the Standard Industry Classification (SIC) Index code 7372, Software Publishing Prepackaged.
|
Ratio Analysis |
||||
|
Year 1 |
Year 2 |
Year 3 |
Industry Profile |
|
|
Sales Growth |
0.00% |
15.00% |
15.00% |
9.70% |
|
Percent of Total Assets |
||||
|
Accounts Receivable |
33.89% |
20.14% |
14.58% |
21.50% |
|
Other Current Assets |
2.30% |
1.19% |
0.75% |
45.70% |
|
Total Current Assets |
93.52% |
93.52% |
93.29% |
70.20% |
|
Long-term Assets |
6.48% |
6.48% |
6.71% |
29.80% |
|
Total Assets |
100.00% |
100.00% |
100.00% |
100.00% |
|
Current Liabilities |
12.35% |
7.29% |
5.23% |
42.40% |
|
Long-term Liabilities |
4.24% |
2.00% |
1.14% |
19.20% |
|
Total Liabilities |
16.59% |
9.29% |
6.37% |
61.60% |
|
Net Worth |
83.41% |
90.71% |
93.63% |
38.40% |
|
Percent of Sales |
||||
|
Sales |
100.00% |
100.00% |
100.00% |
100.00% |
|
Gross Margin |
69.41% |
69.41% |
69.41% |
100.00% |
|
Selling, General & Administrative Expenses |
46.04% |
43.87% |
42.17% |
79.40% |
|
Advertising Expenses |
0.59% |
0.85% |
1.48% |
1.30% |
|
Profit Before Interest and Taxes |
31.36% |
34.22% |
36.46% |
2.20% |
|
Main Ratios |
||||
|
Current |
7.57 |
12.83 |
17.85 |
1.51 |
|
Quick |
7.57 |
12.83 |
17.85 |
1.16 |
|
Total Debt to Total Assets |
16.59% |
9.29% |
6.37% |
61.60% |
|
Pre-tax Return on Net Worth |
117.09% |
69.97% |
52.33% |
3.50% |
|
Pre-tax Return on Assets |
97.67% |
63.47% |
49.00% |
9.20% |
|
Additional Ratios |
Year 1 |
Year 2 |
Year 3 |
|
|
Net Profit Margin |
23.25% |
25.56% |
27.12% |
n.a |
|
Return on Equity |
87.33% |
52.48% |
39.03% |
n.a |
|
Activity Ratios |
||||
|
Accounts Receivable Turnover |
6.10 |
6.10 |
6.10 |
n.a |
|
Collection Days |
57 |
56 |
56 |
n.a |
|
Accounts Payable Turnover |
12.45 |
12.17 |
12.17 |
n.a |
|
Payment Days |
27 |
28 |
28 |
n.a |
|
Total Asset Turnover |
3.13 |
1.86 |
1.35 |
n.a |
|
Debt Ratios |
||||
|
Debt to Net Worth |
0.20 |
0.10 |
0.07 |
n.a |
|
Current Liab. to Liab. |
0.74 |
0.78 |
0.82 |
n.a |
|
Liquidity Ratios |
||||
|
Net Working Capital |
$2,642,456 |
$5,431,538 |
$8,814,522 |
n.a |
|
Interest Coverage |
171.03 |
244.78 |
351.35 |
n.a |
|
Additional Ratios |
||||
|
Assets to Sales |
0.32 |
0.54 |
0.74 |
n.a |
|
Current Debt/Total Assets |
12% |
7% |
5% |
n.a |
|
Acid Test |
4.83 |
10.07 |
15.06 |
n.a |
|
Sales/Net Worth |
3.76 |
2.05 |
1.44 |
n.a |
|
Dividend Payout |
0.00 |
0.00 |
0.00 |
n.a |
Appendix
|
Sales Forecast |
|||||||||||||
|
Month 1 |
Month 2 |
Month 3 |
Month 4 |
Month 5 |
Month 6 |
Month 7 |
Month 8 |
Month 9 |
Month 10 |
Month 11 |
Month 12 |
||
|
Unit Sales |
|||||||||||||
|
Software Systems |
0% |
20 |
20 |
20 |
20 |
20 |
20 |
20 |
20 |
20 |
20 |
20 |
20 |
|
Installation & Customization |
0% |
20 |
20 |
20 |
20 |
20 |
20 |
20 |
20 |
20 |
20 |
20 |
20 |
|
Other Consulting |
0% |
10 |
10 |
10 |
10 |
10 |
10 |
10 |
10 |
10 |
10 |
10 |
10 |
|
Total Unit Sales |
50 |
50 |
50 |
50 |
50 |
50 |
50 |
50 |
50 |
50 |
50 |
50 |
|
|
Unit Prices |
Month 1 |
Month 2 |
Month 3 |
Month 4 |
Month 5 |
Month 6 |
Month 7 |
Month 8 |
Month 9 |
Month 10 |
Month 11 |
Month 12 |
|
|
Software Systems |
$25,000.00 |
$25,000.00 |
$25,000.00 |
$25,000.00 |
$25,000.00 |
$25,000.00 |
$25,000.00 |
$25,000.00 |
$25,000.00 |
$25,000.00 |
$25,000.00 |
$25,000.00 |
|
|
Installation & Customization |
$15,000.00 |
$15,000.00 |
$15,000.00 |
$15,000.00 |
$15,000.00 |
$15,000.00 |
$15,000.00 |
$15,000.00 |
$15,000.00 |
$15,000.00 |
$15,000.00 |
$15,000.00 |
|
|
Other Consulting |
$5,000.00 |
$5,000.00 |
$5,000.00 |
$5,000.00 |
$5,000.00 |
$5,000.00 |
$5,000.00 |
$5,000.00 |
$5,000.00 |
$5,000.00 |
$5,000.00 |
$5,000.00 |
|
|
Sales |
|||||||||||||
|
Software Systems |
$500,000 |
$500,000 |
$500,000 |
$500,000 |
$500,000 |
$500,000 |
$500,000 |
$500,000 |
$500,000 |
$500,000 |
$500,000 |
$500,000 |
|
|
Installation & Customization |
$300,000 |
$300,000 |
$300,000 |
$300,000 |
$300,000 |
$300,000 |
$300,000 |
$300,000 |
$300,000 |
$300,000 |
$300,000 |
$300,000 |
|
|
Other Consulting |
$50,000 |
$50,000 |
$50,000 |
$50,000 |
$50,000 |
$50,000 |
$50,000 |
$50,000 |
$50,000 |
$50,000 |
$50,000 |
$50,000 |
|
|
Total Sales |
$850,000 |
$850,000 |
$850,000 |
$850,000 |
$850,000 |
$850,000 |
$850,000 |
$850,000 |
$850,000 |
$850,000 |
$850,000 |
$850,000 |
|
|
Direct Unit Costs |
Month 1 |
Month 2 |
Month 3 |
Month 4 |
Month 5 |
Month 6 |
Month 7 |
Month 8 |
Month 9 |
Month 10 |
Month 11 |
Month 12 |
|
|
Software Systems |
0.00% |
$2,000.00 |
$2,000.00 |
$2,000.00 |
$2,000.00 |
$2,000.00 |
$2,000.00 |
$2,000.00 |
$2,000.00 |
$2,000.00 |
$2,000.00 |
$2,000.00 |
$2,000.00 |
|
Installation & Customization |
0.00% |
$10,000.00 |
$10,000.00 |
$10,000.00 |
$10,000.00 |
$10,000.00 |
$10,000.00 |
$10,000.00 |
$10,000.00 |
$10,000.00 |
$10,000.00 |
$10,000.00 |
$10,000.00 |
|
Other Consulting |
0.00% |
$2,000.00 |
$2,000.00 |
$2,000.00 |
$2,000.00 |
$2,000.00 |
$2,000.00 |
$2,000.00 |
$2,000.00 |
$2,000.00 |
$2,000.00 |
$2,000.00 |
$2,000.00 |
|
Direct Cost of Sales |
|||||||||||||
|
Software Systems |
$40,000 |
$40,000 |
$40,000 |
$40,000 |
$40,000 |
$40,000 |
$40,000 |
$40,000 |
$40,000 |
$40,000 |
$40,000 |
$40,000 |
|
|
Installation & Customization |
$200,000 |
$200,000 |
$200,000 |
$200,000 |
$200,000 |
$200,000 |
$200,000 |
$200,000 |
$200,000 |
$200,000 |
$200,000 |
$200,000 |
|
|
Other Consulting |
$20,000 |
$20,000 |
$20,000 |
$20,000 |
$20,000 |
$20,000 |
$20,000 |
$20,000 |
$20,000 |
$20,000 |
$20,000 |
$20,000 |
|
|
Subtotal Direct Cost of Sales |
$260,000 |
$260,000 |
$260,000 |
$260,000 |
$260,000 |
$260,000 |
$260,000 |
$260,000 |
$260,000 |
$260,000 |
$260,000 |
$260,000 |
|
|
Personnel Plan |
|||||||||||||
|
Month 1 |
Month 2 |
Month 3 |
Month 4 |
Month 5 |
Month 6 |
Month 7 |
Month 8 |
Month 9 |
Month 10 |
Month 11 |
Month 12 |
||
|
Product Development |
0% |
$75,000 |
$75,000 |
$75,000 |
$75,000 |
$75,000 |
$75,000 |
$75,000 |
$75,000 |
$75,000 |
$75,000 |
$75,000 |
$75,000 |
|
Installation Technicians |
0% |
$72,917 |
$72,917 |
$72,917 |
$72,917 |
$72,917 |
$72,917 |
$72,917 |
$72,917 |
$72,917 |
$72,917 |
$72,917 |
$72,917 |
|
Administrative |
0% |
$49,583 |
$49,583 |
$49,583 |
$49,583 |
$49,583 |
$49,583 |
$49,583 |
$49,583 |
$49,583 |
$49,583 |
$49,583 |
$49,583 |
|
Sales & Marketing |
0% |
$75,000 |
$75,000 |
$75,000 |
$75,000 |
$75,000 |
$75,000 |
$75,000 |
$75,000 |
$75,000 |
$75,000 |
$75,000 |
$75,000 |
|
Other |
0% |
$0 |
$0 |
$0 |
$0 |
$0 |
$0 |
$0 |
$0 |
$0 |
$0 |
$0 |
$0 |
|
Total People |
82 |
82 |
82 |
82 |
82 |
82 |
82 |
82 |
82 |
82 |
82 |
82 |
|
|
Total Payroll |
$272,500 |
$272,500 |
$272,500 |
$272,500 |
$272,500 |
$272,500 |
$272,500 |
$272,500 |
$272,500 |
$272,500 |
$272,500 |
$272,500 |
|
|
General Assumptions |
|||||||||||||
|
Month 1 |
Month 2 |
Month 3 |
Month 4 |
Month 5 |
Month 6 |
Month 7 |
Month 8 |
Month 9 |
Month 10 |
Month 11 |
Month 12 |
||
|
Plan Month |
1 |
2 |
3 |
4 |
5 |
6 |
7 |
8 |
9 |
10 |
11 |
12 |
|
|
Current Interest Rate |
10.00% |
10.00% |
10.00% |
10.00% |
10.00% |
10.00% |
10.00% |
10.00% |
10.00% |
10.00% |
10.00% |
10.00% |
|
|
Long-term Interest Rate |
10.00% |
10.00% |
10.00% |
10.00% |
10.00% |
10.00% |
10.00% |
10.00% |
10.00% |
10.00% |
10.00% |
10.00% |
|
|
Tax Rate |
30.00% |
25.00% |
25.00% |
25.00% |
25.00% |
25.00% |
25.00% |
25.00% |
25.00% |
25.00% |
25.00% |
25.00% |
|
|
Other |
0 |
0 |
0 |
0 |
0 |
0 |
0 |
0 |
0 |
0 |
0 |
0 |
|
|
Pro Forma Profit and Loss |
|||||||||||||
|
Month 1 |
Month 2 |
Month 3 |
Month 4 |
Month 5 |
Month 6 |
Month 7 |
Month 8 |
Month 9 |
Month 10 |
Month 11 |
Month 12 |
||
|
Sales |
$850,000 |
$850,000 |
$850,000 |
$850,000 |
$850,000 |
$850,000 |
$850,000 |
$850,000 |
$850,000 |
$850,000 |
$850,000 |
$850,000 |
|
|
Direct Cost of Sales |
$260,000 |
$260,000 |
$260,000 |
$260,000 |
$260,000 |
$260,000 |
$260,000 |
$260,000 |
$260,000 |
$260,000 |
$260,000 |
$260,000 |
|
|
Other |
$0 |
$0 |
$0 |
$0 |
$0 |
$0 |
$0 |
$0 |
$0 |
$0 |
$0 |
$0 |
|
|
Total Cost of Sales |
$260,000 |
$260,000 |
$260,000 |
$260,000 |
$260,000 |
$260,000 |
$260,000 |
$260,000 |
$260,000 |
$260,000 |
$260,000 |
$260,000 |
|
|
Gross Margin |
$590,000 |
$590,000 |
$590,000 |
$590,000 |
$590,000 |
$590,000 |
$590,000 |
$590,000 |
$590,000 |
$590,000 |
$590,000 |
$590,000 |
|
|
Gross Margin % |
69.41% |
69.41% |
69.41% |
69.41% |
69.41% |
69.41% |
69.41% |
69.41% |
69.41% |
69.41% |
69.41% |
69.41% |
|
|
Expenses |
|||||||||||||
|
Payroll |
$272,500 |
$272,500 |
$272,500 |
$272,500 |
$272,500 |
$272,500 |
$272,500 |
$272,500 |
$272,500 |
$272,500 |
$272,500 |
$272,500 |
|
|
Sales and Marketing and Other Expenses |
$8,000 |
$8,000 |
$8,000 |
$8,000 |
$8,000 |
$8,000 |
$8,000 |
$8,000 |
$8,000 |
$8,000 |
$8,000 |
$8,000 |
|
|
Depreciation |
$2,000 |
$2,000 |
$2,000 |
$2,000 |
$2,000 |
$2,000 |
$2,000 |
$2,000 |
$2,000 |
$2,000 |
$2,000 |
$2,000 |
|
|
Utilities |
$100 |
$100 |
$100 |
$100 |
$100 |
$100 |
$100 |
$100 |
$100 |
$100 |
$100 |
$100 |
|
|
Payroll Taxes |
15% |
$40,875 |
$40,875 |
$40,875 |
$40,875 |
$40,875 |
$40,875 |
$40,875 |
$40,875 |
$40,875 |
$40,875 |
$40,875 |
$40,875 |
|
Other |
$0 |
$0 |
$0 |
$0 |
$0 |
$0 |
$0 |
$0 |
$0 |
$0 |
$0 |
$0 |
|
|
Total Operating Expenses |
$323,475 |
$323,475 |
$323,475 |
$323,475 |
$323,475 |
$323,475 |
$323,475 |
$323,475 |
$323,475 |
$323,475 |
$323,475 |
$323,475 |
|
|
Profit Before Interest and Taxes |
$266,525 |
$266,525 |
$266,525 |
$266,525 |
$266,525 |
$266,525 |
$266,525 |
$266,525 |
$266,525 |
$266,525 |
$266,525 |
$266,525 |
|
|
EBITDA |
$268,525 |
$268,525 |
$268,525 |
$268,525 |
$268,525 |
$268,525 |
$268,525 |
$268,525 |
$268,525 |
$268,525 |
$268,525 |
$268,525 |
|
|
Interest Expense |
$1,650 |
$1,633 |
$1,617 |
$1,600 |
$1,583 |
$1,567 |
$1,550 |
$1,533 |
$1,517 |
$1,500 |
$1,483 |
$1,467 |
|
|
Taxes Incurred |
$79,463 |
$66,223 |
$66,227 |
$66,231 |
$66,235 |
$66,240 |
$66,244 |
$66,248 |
$66,252 |
$66,256 |
$66,260 |
$66,265 |
|
|
Net Profit |
$185,413 |
$198,669 |
$198,681 |
$198,694 |
$198,706 |
$198,719 |
$198,731 |
$198,744 |
$198,756 |
$198,769 |
$198,781 |
$198,794 |
|
|
Net Profit/Sales |
21.81% |
23.37% |
23.37% |
23.38% |
23.38% |
23.38% |
23.38% |
23.38% |
23.38% |
23.38% |
23.39% |
23.39% |
|
|
Pro Forma Cash Flow |
|||||||||||||
|
Month 1 |
Month 2 |
Month 3 |
Month 4 |
Month 5 |
Month 6 |
Month 7 |
Month 8 |
Month 9 |
Month 10 |
Month 11 |
Month 12 |
||
|
Cash Received |
|||||||||||||
|
Cash from Operations |
|||||||||||||
|
Cash Sales |
$289,000 |
$289,000 |
$289,000 |
$289,000 |
$289,000 |
$289,000 |
$289,000 |
$289,000 |
$289,000 |
$289,000 |
$289,000 |
$289,000 |
|
|
Cash from Receivables |
$0 |
$18,700 |
$561,000 |
$561,000 |
$561,000 |
$561,000 |
$561,000 |
$561,000 |
$561,000 |
$561,000 |
$561,000 |
$561,000 |
|
|
Subtotal Cash from Operations |
$289,000 |
$307,700 |
$850,000 |
$850,000 |
$850,000 |
$850,000 |
$850,000 |
$850,000 |
$850,000 |
$850,000 |
$850,000 |
$850,000 |
|
|
Additional Cash Received |
|||||||||||||
|
Sales Tax, VAT, HST/GST Received |
0.00% |
$0 |
$0 |
$0 |
$0 |
$0 |
$0 |
$0 |
$0 |
$0 |
$0 |
$0 |
$0 |
|
New Current Borrowing |
$0 |
$0 |
$0 |
$0 |
$0 |
$0 |
$0 |
$0 |
$0 |
$0 |
$0 |
$0 |
|
|
New Other Liabilities (interest-free) |
$0 |
$0 |
$0 |
$0 |
$0 |
$0 |
$0 |
$0 |
$0 |
$0 |
$0 |
$0 |
|
|
New Long-term Liabilities |
$0 |
$0 |
$0 |
$0 |
$0 |
$0 |
$0 |
$0 |
$0 |
$0 |
$0 |
$0 |
|
|
Sales of Other Current Assets |
$0 |
$0 |
$0 |
$0 |
$0 |
$0 |
$0 |
$0 |
$0 |
$0 |
$0 |
$0 |
|
|
Sales of Long-term Assets |
$0 |
$0 |
$0 |
$0 |
$0 |
$0 |
$0 |
$0 |
$0 |
$0 |
$0 |
$0 |
|
|
New Investment Received |
$0 |
$190,000 |
$0 |
$0 |
$0 |
$0 |
$0 |
$0 |
$0 |
$0 |
$0 |
$0 |
|
|
Subtotal Cash Received |
$289,000 |
$497,700 |
$850,000 |
$850,000 |
$850,000 |
$850,000 |
$850,000 |
$850,000 |
$850,000 |
$850,000 |
$850,000 |
$850,000 |
|
|
Expenditures |
Month 1 |
Month 2 |
Month 3 |
Month 4 |
Month 5 |
Month 6 |
Month 7 |
Month 8 |
Month 9 |
Month 10 |
Month 11 |
Month 12 |
|
|
Expenditures from Operations |
|||||||||||||
|
Cash Spending |
$272,500 |
$272,500 |
$272,500 |
$272,500 |
$272,500 |
$272,500 |
$272,500 |
$272,500 |
$272,500 |
$272,500 |
$272,500 |
$272,500 |
|
|
Bill Payments |
$14,003 |
$389,646 |
$376,831 |
$376,818 |
$376,806 |
$376,793 |
$376,781 |
$376,768 |
$376,756 |
$376,743 |
$376,731 |
$376,718 |
|
|
Subtotal Spent on Operations |
$286,503 |
$662,146 |
$649,331 |
$649,318 |
$649,306 |
$649,293 |
$649,281 |
$649,268 |
$649,256 |
$649,243 |
$649,231 |
$649,218 |
|
|
Additional Cash Spent |
|||||||||||||
|
Sales Tax, VAT, HST/GST Paid Out |
$0 |
$0 |
$0 |
$0 |
$0 |
$0 |
$0 |
$0 |
$0 |
$0 |
$0 |
$0 |
|
|
Principal Repayment of Current Borrowing |
$1,000 |
$1,000 |
$1,000 |
$1,000 |
$1,000 |
$1,000 |
$1,000 |
$1,000 |
$1,000 |
$1,000 |
$1,000 |
$1,000 |
|
|
Other Liabilities Principal Repayment |
$0 |
$0 |
$0 |
$0 |
$0 |
$0 |
$0 |
$0 |
$0 |
$0 |
$0 |
$0 |
|
|
Long-term Liabilities Principal Repayment |
$1,000 |
$1,000 |
$1,000 |
$1,000 |
$1,000 |
$1,000 |
$1,000 |
$1,000 |
$1,000 |
$1,000 |
$1,000 |
$1,000 |
|
|
Purchase Other Current Assets |
$0 |
$0 |
$0 |
$0 |
$0 |
$0 |
$0 |
$0 |
$0 |
$0 |
$0 |
$0 |
|
|
Purchase Long-term Assets |
$0 |
$0 |
$0 |
$15,000 |
$15,000 |
$15,000 |
$15,000 |
$15,000 |
$15,000 |
$15,000 |
$15,000 |
$15,000 |
|
|
Dividends |
$0 |
$0 |
$0 |
$0 |
$0 |
$0 |
$0 |
$0 |
$0 |
$0 |
$0 |
$0 |
|
|
Subtotal Cash Spent |
$288,503 |
$664,146 |
$651,331 |
$666,318 |
$666,306 |
$666,293 |
$666,281 |
$666,268 |
$666,256 |
$666,243 |
$666,231 |
$666,218 |
|
|
Net Cash Flow |
$497 |
($166,446) |
$198,669 |
$183,682 |
$183,694 |
$183,707 |
$183,719 |
$183,732 |
$183,744 |
$183,757 |
$183,769 |
$183,782 |
|
|
Cash Balance |
$180,497 |
$14,051 |
$212,721 |
$396,402 |
$580,096 |
$763,803 |
$947,522 |
$1,131,254 |
$1,314,998 |
$1,498,755 |
$1,682,524 |
$1,866,306 |
|
|
Pro Forma Balance Sheet |
|||||||||||||
|
Month 1 |
Month 2 |
Month 3 |
Month 4 |
Month 5 |
Month 6 |
Month 7 |
Month 8 |
Month 9 |
Month 10 |
Month 11 |
Month 12 |
||
|
Assets |
Starting Balances |
||||||||||||
|
Current Assets |
|||||||||||||
|
Cash |
$180,000 |
$180,497 |
$14,051 |
$212,721 |
$396,402 |
$580,096 |
$763,803 |
$947,522 |
$1,131,254 |
$1,314,998 |
$1,498,755 |
$1,682,524 |
$1,866,306 |
|
Accounts Receivable |
$0 |
$561,000 |
$1,103,300 |
$1,103,300 |
$1,103,300 |
$1,103,300 |
$1,103,300 |
$1,103,300 |
$1,103,300 |
$1,103,300 |
$1,103,300 |
$1,103,300 |
$1,103,300 |
|
Other Current Assets |
$75,000 |
$75,000 |
$75,000 |
$75,000 |
$75,000 |
$75,000 |
$75,000 |
$75,000 |
$75,000 |
$75,000 |
$75,000 |
$75,000 |
$75,000 |
|
Total Current Assets |
$255,000 |
$816,497 |
$1,192,351 |
$1,391,021 |
$1,574,702 |
$1,758,396 |
$1,942,103 |
$2,125,822 |
$2,309,554 |
$2,493,298 |
$2,677,055 |
$2,860,824 |
$3,044,606 |
|
Long-term Assets |
|||||||||||||
|
Long-term Assets |
$100,000 |
$100,000 |
$100,000 |
$100,000 |
$115,000 |
$130,000 |
$145,000 |
$160,000 |
$175,000 |
$190,000 |
$205,000 |
$220,000 |
$235,000 |
|
Accumulated Depreciation |
$0 |
$2,000 |
$4,000 |
$6,000 |
$8,000 |
$10,000 |
$12,000 |
$14,000 |
$16,000 |
$18,000 |
$20,000 |
$22,000 |
$24,000 |
|
Total Long-term Assets |
$100,000 |
$98,000 |
$96,000 |
$94,000 |
$107,000 |
$120,000 |
$133,000 |
$146,000 |
$159,000 |
$172,000 |
$185,000 |
$198,000 |
$211,000 |
|
Total Assets |
$355,000 |
$914,497 |
$1,288,351 |
$1,485,021 |
$1,681,702 |
$1,878,396 |
$2,075,103 |
$2,271,822 |
$2,468,554 |
$2,665,298 |
$2,862,055 |
$3,058,824 |
$3,255,606 |
|
Liabilities and Capital |
Month 1 |
Month 2 |
Month 3 |
Month 4 |
Month 5 |
Month 6 |
Month 7 |
Month 8 |
Month 9 |
Month 10 |
Month 11 |
Month 12 |
|
|
Current Liabilities |
|||||||||||||
|
Accounts Payable |
$1,000 |
$377,085 |
$364,270 |
$364,258 |
$364,246 |
$364,234 |
$364,222 |
$364,210 |
$364,198 |
$364,186 |
$364,174 |
$364,161 |
$364,149 |
|
Current Borrowing |
$50,000 |
$49,000 |
$48,000 |
$47,000 |
$46,000 |
$45,000 |
$44,000 |
$43,000 |
$42,000 |
$41,000 |
$40,000 |
$39,000 |
$38,000 |
|
Other Current Liabilities |
$0 |
$0 |
$0 |
$0 |
$0 |
$0 |
$0 |
$0 |
$0 |
$0 |
$0 |
$0 |
$0 |
|
Subtotal Current Liabilities |
$51,000 |
$426,085 |
$412,270 |
$411,258 |
$410,246 |
$409,234 |
$408,222 |
$407,210 |
$406,198 |
$405,186 |
$404,174 |
$403,161 |
$402,149 |
|
Long-term Liabilities |
$150,000 |
$149,000 |
$148,000 |
$147,000 |
$146,000 |
$145,000 |
$144,000 |
$143,000 |
$142,000 |
$141,000 |
$140,000 |
$139,000 |
$138,000 |
|
Total Liabilities |
$201,000 |
$575,085 |
$560,270 |
$558,258 |
$556,246 |
$554,234 |
$552,222 |
$550,210 |
$548,198 |
$546,186 |
$544,174 |
$542,161 |
$540,149 |
|
Paid-in Capital |
$178,000 |
$178,000 |
$368,000 |
$368,000 |
$368,000 |
$368,000 |
$368,000 |
$368,000 |
$368,000 |
$368,000 |
$368,000 |
$368,000 |
$368,000 |
|
Retained Earnings |
($24,000) |
($24,000) |
($24,000) |
($24,000) |
($24,000) |
($24,000) |
($24,000) |
($24,000) |
($24,000) |
($24,000) |
($24,000) |
($24,000) |
($24,000) |
|
Earnings |
$0 |
$185,413 |
$384,081 |
$582,763 |
$781,456 |
$980,163 |
$1,178,881 |
$1,377,613 |
$1,576,356 |
$1,775,113 |
$1,973,881 |
$2,172,663 |
$2,371,456 |
|
Total Capital |
$154,000 |
$339,413 |
$728,081 |
$926,763 |
$1,125,456 |
$1,324,163 |
$1,522,881 |
$1,721,613 |
$1,920,356 |
$2,119,113 |
$2,317,881 |
$2,516,663 |
$2,715,456 |
|
Total Liabilities and Capital |
$355,000 |
$914,497 |
$1,288,351 |
$1,485,021 |
$1,681,702 |
$1,878,396 |
$2,075,103 |
$2,271,822 |
$2,468,554 |
$2,665,298 |
$2,862,055 |
$3,058,824 |
$3,255,606 |
|
Net Worth |
$154,000 |
$339,413 |
$728,081 |
$926,763 |
$1,125,456 |
$1,324,163 |
$1,522,881 |
$1,721,613 |
$1,920,356 |
$2,119,113 |
$2,317,881 |
$2,516,663 |
$2,715,456 |