Educational Website Business Plan
One Week At A Time
Executive Summary
One Week At A Time is a website business based in Lexington, Kentucky that is owned and operated by Frank Williams. The website aims to educate people on how they can help the Earth and lessen their environmental impact by accomplishing one task each week for 52 weeks. The tasks are simple and will show people how easily they can make small changes in their life to make a difference in their world. The revenue stream for this website will come from commissions on recommendations of Earth-friendly products that fit with our weekly tips. We will have affiliate relationships with retailers providing these products so we won't be producing them or carrying inventory, just earning commission on each sale.
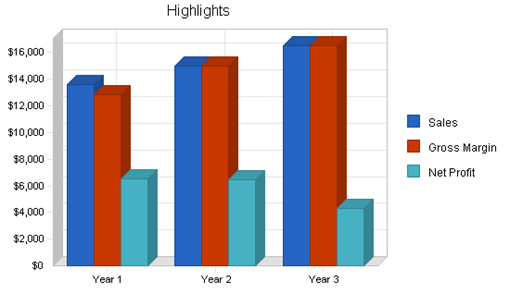
Our financial strategy is based on staying profitable while keeping expenses extremely low. We plan on using profits to support environmental causes we believe in, so it's not our mission to earn as much money as humanly possible. We're more concerned with keeping the cash flow and cash balance positive. The accompanying chart highlights our financial plans.
In order to reach our goals, we must complete the following keys of success:
- We must develop quality content in the form of our tips which engage the readers, empower them, and inspire them to share the tips with others, and so, grow our user base.
- We must execute our marketing plan well, since the focus is on not spending money, while maximizing our online exposure.
- We must keep our expenses low. We don't plan on generating a large amount of revenue in the near-term, so we can't let expenses get out of control.
- We must pre-sell our product recommendations in order to get users to purchase through our site, thereby garnering our commissions.
1.1 Mission
One Week At A Time is an educational website that teaches busy people how they can help the environment by accomplishing simple weekly tasks over the period of one year. We hope to help people become more environmentally conscious, help retailers sell Earth-friendly products, and use our commissions to pay our expenses and contribute profits to environmental causes.
1.2 Objectives
- Use simple weekly tasks to teach people how they can help the environment and lessen their personal environmental impact.
- To sign up 5,000 subscribers to our weekly environmental tips list at the end of the first year.
- To receive 10,000 visitors per month to our website.
- To achieve profitability within six months.
- To use all company profits to contribute to environmental organizations and causes.
1.3 Keys to Success
- Quality Content: Write good weekly tips which are simply written, friendly, to the point, and inspire people to accomplish their weekly task.
- Marketing: Focus on link-building, search engine optimization, and word of mouth to spread the word about our website and email tips.
- Expenses: Keep other expenses low to make achieving profitability easier. There is no need to spend a lot of money in order to accomplish our goals quicker.
- Promote and pre-sell Earth-friendly products in a way that inspires our users to buy using our site's links so we receive our commissions.
Company Summary
One Week At A Time is a small sole proprietor website based in Lexington, Kentucky. Its purpose is to educate busy people on how they can help lessen their personal environmental impact by completing weekly tasks as outlined on the website. The site offers these tasks both on the site, or by a weekly email subscription that is free of charge. Revenue is generated by earning commissions on Earth-friendly products sold to subscribers by recommended retailers.
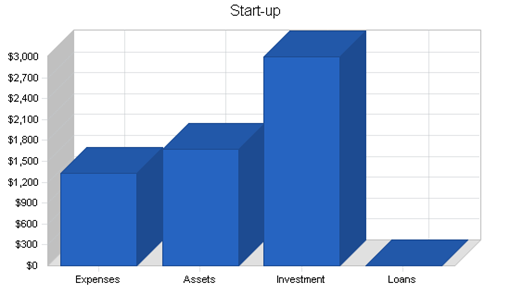
2.1 Start-up Summary
One Week At A Time will start with an initial $3,000 investment from Frank Williams to get the website and company going. Mr. Williams plans on doing all the initial website design and content creation himself, so there is no monetary cost associated with those items. That leaves $250 in legal expenses to form the company, $1,000 in computer equipment, and $75 to register the domain name for the website.
The initial investment will cover these items and leave a cash balance of $1,675 to cover expenses until income comes in as the company moves forward.
|
Start-up Funding |
|
|
Start-up Expenses to Fund |
$1,325 |
|
Start-up Assets to Fund |
$1,675 |
|
Total Funding Required |
$3,000 |
|
Assets |
|
|
Non-cash Assets from Start-up |
$0 |
|
Cash Requirements from Start-up |
$1,675 |
|
Additional Cash Raised |
$0 |
|
Cash Balance on Starting Date |
$1,675 |
|
Total Assets |
$1,675 |
|
Liabilities and Capital |
|
|
Liabilities |
|
|
Current Borrowing |
$0 |
|
Long-term Liabilities |
$0 |
|
Accounts Payable (Outstanding Bills) |
$0 |
|
Other Current Liabilities (interest-free) |
$0 |
|
Total Liabilities |
$0 |
|
Capital |
|
|
Planned Investment |
|
|
Frank Williams |
$3,000 |
|
Other |
$0 |
|
Additional Investment Requirement |
$0 |
|
Total Planned Investment |
$3,000 |
|
Loss at Start-up (Start-up Expenses) |
($1,325) |
|
Total Capital |
$1,675 |
|
Total Capital and Liabilities |
$1,675 |
|
Total Funding |
$3,000 |
|
Start-up |
|
|
Requirements |
|
|
Start-up Expenses |
|
|
Legal |
$250 |
|
Domain Name |
$75 |
|
Computer Equipment |
$1,000 |
|
Total Start-up Expenses |
$1,325 |
|
Start-up Assets |
|
|
Cash Required |
$1,675 |
|
Other Current Assets |
$0 |
|
Long-term Assets |
$0 |
|
Total Assets |
$1,675 |
|
Total Requirements |
$3,000 |
2.2 Company Ownership
One Week At A Time is a sole-proprietorship, founded, owned and operated by Frank Williams of Lexington, Kentucky.
Products
One Week At A Time does not actually produce any products or services. We recommend Earth-friendly products from various retailers who pay us a commission based on the amount of the sale. These are usually referred to as "affiliate relationships" and "affiliate commissions" in the Web world.
The advantage to this setup is that we don't have any cost of goods, we don't have to worry about production, inventory levels, fulfillment, or customer service. The negative aspect is that we obviously only receive a percentage of the sale instead of the full amount of the sale.
We will be recommending Earth-friendly products of the following types:
- Reusable Products: Reusable replacements for everyday products that are normally disposed of after one use such as rechargeable batteries, reusable lunch bags, etc.
- Recycled Paper Products: Printer paper, envelopes, stationary, etc.
- Kitchen Products: Cloth towels, cloth rags, etc.
- Organic Foods: Fruits, vegetables, snack foods, etc.
- Cloth Diapers
- Clothing: Made by Earth-Friendly companies such as Lands' End, L.L. Bean, etc.
- Cleaning Products: Organic and chlorine/chemical free cleaning products like carpet cleaner, laundry detergent, dish soap, car wash soap, etc.
- Herbal Medicines
- Lighting: Energy Star approved lighting which uses less energy than standard bulbs and lighting products.
- Heating/Cooling Equipment: Hot Water Heater jackets, Energy Star air conditioners, heaters, etc.
- Books: About being Earth-friendly.
- Music: By Earth-Friendly artists or ones whose proceeds are donated to environmental organizations.
- Low Water Usage: Shower heads, hose nozzles, and other water-reducing gadgets.
- Energy Star Appliances: Kitchen appliances, TVs, monitors, etc.
- Solar Powered Appliances: Major and minor appliances, tools and gadgets that run on solar power.
Market Analysis Summary
One Week At A Time targets all people in general, but the content will be slanted towards what we call "busy people." These are people who most likely have busy lives such as being a full-time student, working, having a family, etc. These people often feel that they're too busy to help the Earth, and often think it takes a ton of work to lessen their environmental impact. They tend to be in the 18-55 age range, moderate to high income level, and they live in all geographical locations. Obviously, our market must have access to the Internet in order to view our site.
Our secondary markets are students who range from 12-22 in age who can get started early on being Earth-friendly, and the retired community who may have more free time to help live an Earth-friendly life.
These markets really encompass everyone, but we expect our primary market to account for a majority of our visitors and sales.
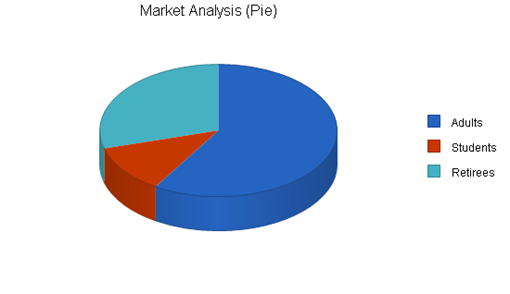
4.1 Market Segmentation
We segment our market by their "state in life." By "state in life" we mean what age and point in life the people in the market are in. Usually their "state of life" has a bearing on what their interests are, how much free time they have, and how much income they have. Our market is segmented in the following way:
- Students: Students range from 12-22 years old. Geography is not important beyond the fact that our site will only be in English.
- Adults: Adults are people in the 18-55 year old range who are working full or part-time jobs and may or may not be very busy with their work and family lives. Geography is not important beyond the fact that our site will only be in English.
- Retirees: Retirees are over 55 years old in age and geography is not a factor beyond the site only being in English.
|
Market Analysis |
|||||||
|
Year 1 |
Year 2 |
Year 3 |
Year 4 |
Year 5 |
|||
|
Potential Customers |
Growth |
CAGR |
|||||
|
Adults |
10% |
10,000,000 |
11,000,000 |
12,100,000 |
13,310,000 |
14,641,000 |
10.00% |
|
Students |
5% |
2,000,000 |
2,100,000 |
2,205,000 |
2,315,250 |
2,431,013 |
5.00% |
|
Retirees |
10% |
5,000,000 |
5,500,000 |
6,050,000 |
6,655,000 |
7,320,500 |
10.00% |
|
Total |
9.45% |
17,000,000 |
18,600,000 |
20,355,000 |
22,280,250 |
24,392,513 |
9.45% |
4.2 Target Market Segment Strategy
One Week At A Time's main goal is to help people live in a more Earth-friendly manner, so that's the main reason why we are targeting any market in general, but there are specific reasons we'll tailor content to our different market segments.
- Students: They usually have a low-level of income so we're not counting on this market for providing us revenue in the way of product sales, but we are targeting students because of the importance that they become educated on how to live in an Earth-friendly manner. It might be a cliche', but the children are the future.
- Adults: This is our largest market and our true target for generating revenue. They have the highest income level, and are the most likely to be buying the types of products we'll be pushing. These are also the "busy people" who we're trying to make it easy on to lessen their environmental impact.
- Retirees: They most likely have more free time to spend donating to environmental organizations and causes. Their income level is dependant on their retirement savings and their age, so we aren't counting on them for providing much revenue, but they might contribute in a meaningful manner.
4.3 Industry Analysis
One Week At A Time actually falls in two different industries.
- We are an environmental education website. This means our primary competition is other environmental education websites, but because our goal is simply to educate people, we aren't really competing with these people in the classic sense of competition. There are many environmental websites, and most of them are either environmental news sites, or they focus on one or two specific environmental topics. We cover many topics, and take a different approach with our weekly task email approach instead of just giving people information. We educate them while giving them a specific task and action to make a difference.
- We are an Earth-friendly product retailing website. Although our site doesn't actually sell the products specifically, we are competing for the sales with every site that sells a similar or competing environmental product to any of the products that we recommend on our site.
4.3.1 Competition and Buying Patterns
The content on the One Week At A Time website will generally be aimed at people who are not experts on living an Earth-friendly life. People who are already experts most likely will not need our site to get information on how they can help the environment, or need our site to point them to Earth-friendly products. Therefore, most of the time we'll be introducing people to ways they can help their environment, and introducing them to products they might not know even exist.
Our customers will choose us over competing environmental websites because we won't overwhelm them with information. We will provide a fun writing style with weekly tasks that actually have our visitors accomplish something that helps the Earth or lessens their impact. These changes will be noticeable to them, and we believe we will make people happy and feel empowered from using our site, while also forming a personal relationship with our site. We feel this will cause them to recommend our site to friends, and to listen to our product recommendations and buy directly from the links on our site and in our emails.
We will make the product-finding process simple, because it can often be overwhelming. If someone tells you that you should buy a chlorine-free cleaner, how do you know where to find that or which one to choose out of the many options? Users of One Week At A Time will trust us and we will simplify the process by giving them one or two choices and retailers to choose from to buy that chlorine-free cleaner.
Strategy and Implementation Summary
The strategy of One Week At A Time is to perform the following tasks to achieve our goals:
- We aim to market the site using search engine placement, links, pay-per-click advertising, and word of mouth. All effective and cheap ways to build an audience.
- We aim to build trust with our users so they will buy the products we recommend.
- We aim to keep our expenses extremely low to make profitability easy to achieve.
5.1 Competitive Edge
The competitive edge of One Week At A Time is that we're providing our content in a fun format that allows people to accomplish tasks on a weekly basis that will show them progress towards making the world a better place. This kind of empowerment is very powerful. Other environmental education sites simply give out information and provide some tips in a list format, but very few sites give people actual tasks, and we haven't seen any sites that do what we will do with sending out a weekly email each week for a year with a task. This keeps our site within the visitor's thought process for a year. Which means they'll also be looking at the products we recommend for a year.
Another competitive edge we have is affiliate and online marketing experience from other websites Mr. Williams has been a part of. Other sites are usually just run by environmental organizations and are not using the Web to it's fullest potential.
5.2 Marketing Strategy
The key to our marketing strategy is search engine and directory placement. We plan on getting users in this manner because we know they're actively looking for information and tips in this area. Mr. Williams is an expert in this arena, and we've done extensive research on keywords that people use when looking for information and tips on environmental topics. We are building our site with these keywords built into the titles and site copy to get good placement in the search engines.
Our site is also a fun and interesting educational concept, so we will embark on a link-building strategy to garner hundreds of links to our site from other environmental and educational websites. Besides the direct traffic, this also increases our site's popularity in the search engines.
We will also use pay-per-click search engines to bid on terms for the types of products that we recommend to bring users looking for those products directly to our site first.
Our last and potentially most important strategy is word-of-mouth or viral marketing. We hope that our content is so compelling and fun for people that they'll enjoy sharing our email tips with their friends, family, class, classmates, co-workers, and anyone else who might be interested. In fact, one of our weekly tips in our 52-weeks of tips is to share our site with others!
5.3 Sales Strategy
The key to sales at One Week At A Time is to develop a level of trust with our visitors through our content. We must convince them we are knowledgeable, have their best interests in mind, and that we recommend products that will make their life better by helping the Earth.
After that is accomplished, we must "pre-sell" the product. Pre-selling is the key technique to successful affiliate sales on the Web. We can't simply place a link to a product and say "Buy This." We must pre-sell the product to the user by explaining to them why they need such a product, why that product is the right one, and why the retailer we're recommending is the right one to buy it from. Using things like our own personal experience with the product, examples of why it's good, and testimonials from other users will be keys to pre-selling our recommended products.
Another aspect of trust and the products is that we must recommend high-quality products that satisfy the buyer. If we recommend bad products, they will lose trust in us and the products we recommend. We must avoid this at all costs.
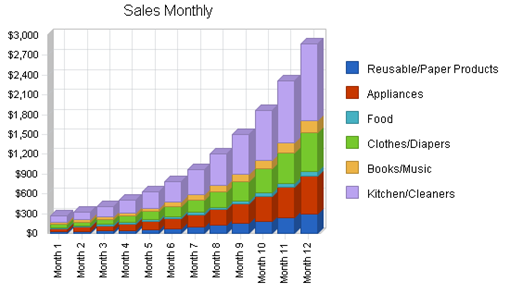
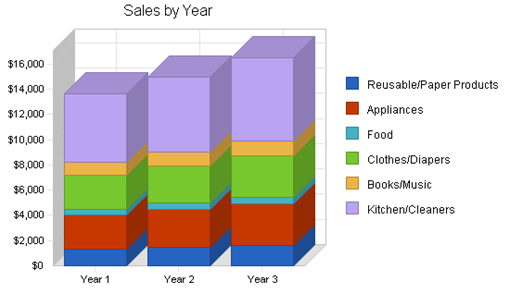
5.3.1 Sales Forecast
Our sales forecast is very conservative because affiliate sales are usually worse than people initially expect.
We feel that we're experts in how to sell affiliate products, but we still want to keep things conservative.
Our only costs of sales are under $100/month spending on pay-per-click advertising.
Our initial sales levels are what we feel we can make on just a few sales of each type of product in the first month.
Since affiliate commissions range from 5-15%, we looked at the average price of the products in each category and came up with what our commission would be on just a few sales in that product category.
We then set our growth rates in the 10-20% rate based on how popular the category is and how fast we feel we can bring new visitors to the site.
|
Sales Forecast |
|||
|
Year 1 |
Year 2 |
Year 3 |
|
|
Sales |
|||
|
Reusable/Paper Products |
$1,355 |
$1,491 |
$1,640 |
|
Appliances |
$2,710 |
$2,981 |
$3,280 |
|
Food |
$435 |
$479 |
$526 |
|
Clothes/Diapers |
$2,710 |
$2,981 |
$3,280 |
|
Books/Music |
$990 |
$1,088 |
$1,197 |
|
Kitchen/Cleaners |
$5,421 |
$5,963 |
$6,559 |
|
Total Sales |
$13,621 |
$14,983 |
$16,482 |
|
Direct Cost of Sales |
Year 1 |
Year 2 |
Year 3 |
|
Online Marketing |
$796 |
$0 |
$0 |
|
Other |
$0 |
$0 |
$0 |
|
Subtotal Direct Cost of Sales |
$796 |
$0 |
$0 |
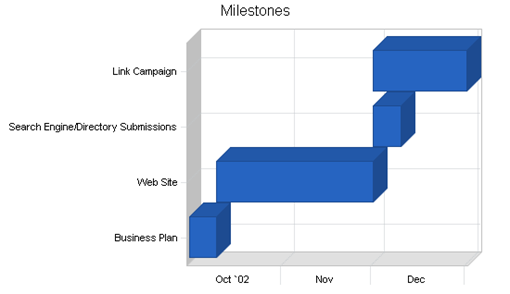
5.4 Milestones
The Milestones table for One Week At A Time is very simple, but so is this business. Our development consists of a few major milestones:
- Completing the Business Plan: We feel an organized and good business plan is an essential key to success.
- Website Development: This includes creating the site design, database and email system, creating affiliate relationships, and writing all the content for the weekly tasks. This is obviously very important, because in a sense our website is our product.
- Search Engine Optimization and Submission: This step is crucial to generating traffic to our website. We must get in the search engines for the keyword terms our research has identified.
- Link Building Campaign: As crucial as the search engines, this is the key second step of our marketing by getting hundreds of links to our site from other environmental and educational sites.
|
Milestones |
|||||
|
Milestone |
Start Date |
End Date |
Budget |
Manager |
Department |
|
Business Plan |
10/1/2002 |
10/10/2002 |
$0 |
Frank Williams |
Management |
|
Web Site |
10/10/2002 |
12/1/2002 |
$0 |
Frank Williams |
Web |
|
Search Engine/Directory Submissions |
12/1/2002 |
12/10/2002 |
$500 |
Frank Williams |
Marketing |
|
Link Campaign |
12/1/2002 |
1/1/2003 |
$0 |
Frank Williams |
Web |
|
Totals |
$500 |
||||
Web Plan Summary
The One Week At A Time website is the focus of our entire operation as it's the only part of our company that interfaces with the customer.
The website will have a very simple design. The graphics will be minimal and we will keep unnecessary text out of the site as much as possible.
The website will simply explain a brief description and mission statement on the front page, have links to some environmental news, and then push the user towards doing one of the three following tasks:
- Signing up for our weekly email tasks subscription.
- Immediately going and browsing our weekly tips.
- Reading our full mission statement to find out what the site is all about.
The back end of the website will be pretty simple as we'll have a database storing the tips and subscriptions to the weekly tips newsletter. It will be a simple design to make it easy to maintain and to be fast and efficient so the majority of Mr. Williams time isn't spent dealing with technical website issues.
6.1 Website Marketing Strategy
The One Week At A Time website has four basic website marketing strategies:
- Search Engine Placement: The site copy is being initially written to contain keywords and phrases we know people are using in the search engines to find this type of content. Combined with good title tags and our simple design, we shouldn't have a tough time getting decent placement for those search terms.
- Link Building: In order to get more direct traffic, and to improve our search engine placement we intend on having a link building campaign to get links to our site from other environmental and educational websites. We will have a Resources section on our site that we'll use to exchange links with other sites.
- Pay-Per-Click: We will use Overture and Google Adwords to generate traffic via pay-per-click advertising. We'll bid on keywords that relate to the products that we recommend on the site.
- Word of Mouth: The content of our site should be compelling enough that people naturally want to pass on our weekly tips to friends, co-workers, family, classmates, etc. We'll also have one weekly task which consists of telling others about our site, and have easy "send to a friend" options for our tips listed on our site.
6.2 Development Requirements
The development requirements for our website fall into three distinct phases:
- Front End: The first step in our site development process is to develop the graphic look and layout for the site. We'll develop one look and template we'll use for all pages, so we estimate this will take about one week.
- Back End: The second step is to code the part of our system that holds and distributes our content. We'll create a database to store our weekly tips and information about those tips. We'll also create a database to store the email address and other information about the people who've subscribed to our weekly tasks. Both these systems will interface with our front end since people will subscribe via the website, and we'll use a Web form to write and edit our weekly tips in the database.
- Tip Writing: After we have created the system, we'll add content for the 52 weeks. We will write one tip at a time which will consist of a tip background and overview of the problem the tip helps to solve, the specific tip action, links to any products related to it, and links to other resources where people can learn more if they so choose.
Management Summary
The management of One Week At A Time is very simple as the company is owned and operated by a single person, Mr. Frank Williams.
We have no immediate plans to hire any additional personnel, and would only do so in the case that the business really took off and new revenue opportunities were created. At this point with our current forecast we don't see that happening in the next two years.
7.1 Personnel Plan
Frank Williams is the only planned employee for One Week At A Time. He will not be taking a salary until revenues have grown to a level that make that possible. We project that will happen in September of 2003. At that time he will begin taking a modest $500/month salary since this job is not full-time.
|
Personnel Plan |
|||
|
Year 1 |
Year 2 |
Year 3 |
|
|
Frank Williams |
$1,000 |
$2,000 |
$4,000 |
|
Other |
$0 |
$0 |
$0 |
|
Total People |
1 |
1 |
1 |
|
Total Payroll |
$1,000 |
$2,000 |
$4,000 |
Financial Plan
One Week At A Time is a business that is very financially simple. Our only expenses consist of marketing, website hosting, and one salary starting in late 2003. Our marketing expenses and salary could even be cut if necessary, since generating lots of income isn't the primary goal for this business.
Even though generating tons of cash and a huge salary isn't the goal, we do want to remain profitable and keep a positive cash flow and cash balance to keep the business running strong and keep it healthy. As long as we keep our expenses low, even minor amounts of sales should achieve that goal, as shown in the following financial plan.
8.1 Important Assumptions
The Financial Plan for One Week At A Time makes the following assumptions:
- That we will be able to generate traffic for our website through our marketing methods.
- That affiliate programs for Earth-friendly products will remain available and that those retailers will stay in business and fulfill orders correctly and on time.
- That people will remain interested in helping the environment.
|
General Assumptions |
|||
|
Year 1 |
Year 2 |
Year 3 |
|
|
Plan Month |
1 |
2 |
3 |
|
Current Interest Rate |
10.00% |
10.00% |
10.00% |
|
Long-term Interest Rate |
10.00% |
10.00% |
10.00% |
|
Tax Rate |
30.00% |
30.00% |
30.00% |
|
Other |
0 |
0 |
0 |
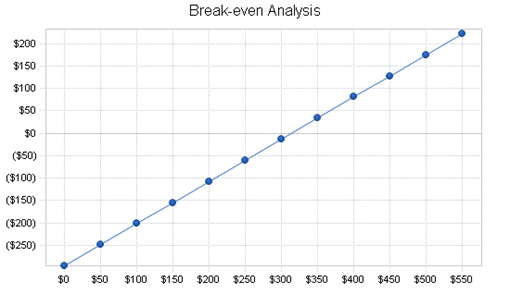
8.2 Break-even Analysis
Our Break-even Analysis is quite simple. We earn revenue by receiving commissions on products we recommend in our weekly tips. This means we don't produce any products so we don't have a variable unit cost. We estimate that we'll receive around $2 per sale made since most of the companies will pay 5-15% in commission on products ranging from $5-$20.
Our fixed costs are cheap. This accounts for our website hosting, miscellaneous bills and expenses, and some search engine marketing.
|
Break-even Analysis |
|
|
Monthly Revenue Break-even |
$314 |
|
Assumptions: |
|
|
Average Percent Variable Cost |
6% |
|
Estimated Monthly Fixed Cost |
$296 |
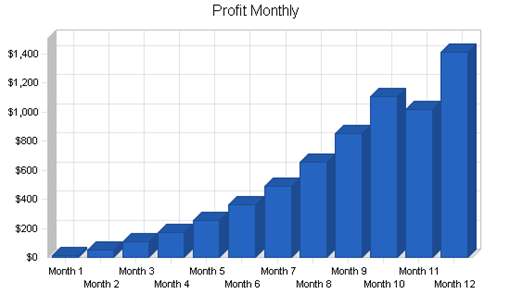
8.3 Projected Profit and Loss
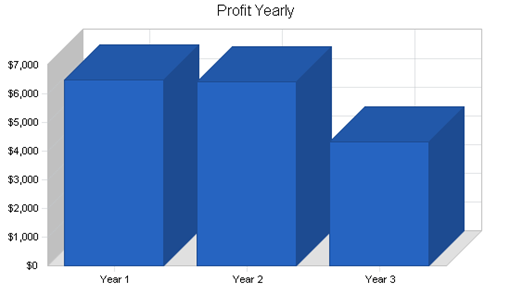
One Week At A Time expects to have a tremendous net profit due to our lack of expenses, cost of goods, and only having one employee. Conversely, we don't expect to generate a huge amount of sales, or really end up earning that much in net income.
We expect to reach net profit for 2003 and 2004 which we plan on contributing to various environmental causes we support.
|
Pro Forma Profit and Loss |
|||
|
Year 1 |
Year 2 |
Year 3 |
|
|
Sales |
$13,621 |
$14,983 |
$16,482 |
|
Direct Cost of Sales |
$796 |
$0 |
$0 |
|
Other Costs of Goods |
$0 |
$0 |
$0 |
|
Total Cost of Sales |
$796 |
$0 |
$0 |
|
Gross Margin |
$12,825 |
$14,983 |
$16,482 |
|
Gross Margin % |
94.16% |
100.00% |
100.00% |
|
Expenses |
|||
|
Payroll |
$1,000 |
$2,000 |
$4,000 |
|
Sales and Marketing and Other Expenses |
$1,200 |
$2,300 |
$4,500 |
|
Depreciation |
$0 |
$0 |
$0 |
|
Web Site Hosting |
$1,200 |
$1,200 |
$1,200 |
|
Payroll Taxes |
$150 |
$300 |
$600 |
|
Other |
$0 |
$0 |
$0 |
|
Total Operating Expenses |
$3,550 |
$5,800 |
$10,300 |
|
Profit Before Interest and Taxes |
$9,275 |
$9,183 |
$6,182 |
|
EBITDA |
$9,275 |
$9,183 |
$6,182 |
|
Interest Expense |
$0 |
$0 |
$0 |
|
Taxes Incurred |
$2,783 |
$2,755 |
$1,855 |
|
Net Profit |
$6,493 |
$6,428 |
$4,327 |
|
Net Profit/Sales |
47.67% |
42.90% |
26.25% |
8.4 Business Ratios
The ratios in our table should point to One Week At A Time being a simple business with a chance and level of profitability.
|
Ratio Analysis |
||||
|
Year 1 |
Year 2 |
Year 3 |
Industry Profile |
|
|
Sales Growth |
0.00% |
10.00% |
10.00% |
0.00% |
|
Percent of Total Assets |
||||
|
Other Current Assets |
0.00% |
0.00% |
0.00% |
100.00% |
|
Total Current Assets |
100.00% |
100.00% |
100.00% |
100.00% |
|
Long-term Assets |
0.00% |
0.00% |
0.00% |
0.00% |
|
Total Assets |
100.00% |
100.00% |
100.00% |
100.00% |
|
Current Liabilities |
10.25% |
3.56% |
3.42% |
0.00% |
|
Long-term Liabilities |
0.00% |
0.00% |
0.00% |
0.00% |
|
Total Liabilities |
10.25% |
3.56% |
3.42% |
0.00% |
|
Net Worth |
89.75% |
96.44% |
96.58% |
100.00% |
|
Percent of Sales |
||||
|
Sales |
100.00% |
100.00% |
100.00% |
100.00% |
|
Gross Margin |
94.16% |
100.00% |
100.00% |
0.00% |
|
Selling, General & Administrative Expenses |
46.49% |
57.10% |
73.75% |
0.00% |
|
Advertising Expenses |
0.00% |
0.00% |
0.00% |
0.00% |
|
Profit Before Interest and Taxes |
68.10% |
61.29% |
37.51% |
0.00% |
|
Main Ratios |
||||
|
Current |
9.76 |
28.09 |
29.23 |
0.00 |
|
Quick |
9.76 |
28.09 |
29.23 |
0.00 |
|
Total Debt to Total Assets |
10.25% |
3.56% |
3.42% |
0.00% |
|
Pre-tax Return on Net Worth |
113.56% |
62.92% |
32.67% |
0.00% |
|
Pre-tax Return on Assets |
101.92% |
60.68% |
31.55% |
0.00% |
|
Additional Ratios |
Year 1 |
Year 2 |
Year 3 |
|
|
Net Profit Margin |
47.67% |
42.90% |
26.25% |
n.a |
|
Return on Equity |
79.49% |
44.04% |
22.87% |
n.a |
|
Activity Ratios |
||||
|
Accounts Payable Turnover |
6.57 |
12.17 |
12.17 |
n.a |
|
Payment Days |
27 |
41 |
27 |
n.a |
|
Total Asset Turnover |
1.50 |
0.99 |
0.84 |
n.a |
|
Debt Ratios |
||||
|
Debt to Net Worth |
0.11 |
0.04 |
0.04 |
n.a |
|
Current Liab. to Liab. |
1.00 |
1.00 |
1.00 |
n.a |
|
Liquidity Ratios |
||||
|
Net Working Capital |
$8,168 |
$14,596 |
$18,923 |
n.a |
|
Interest Coverage |
0.00 |
0.00 |
0.00 |
n.a |
|
Additional Ratios |
||||
|
Assets to Sales |
0.67 |
1.01 |
1.19 |
n.a |
|
Current Debt/Total Assets |
10% |
4% |
3% |
n.a |
|
Acid Test |
9.76 |
28.09 |
29.23 |
n.a |
|
Sales/Net Worth |
1.67 |
1.03 |
0.87 |
n.a |
|
Dividend Payout |
0.00 |
0.00 |
0.00 |
n.a |
8.5 Projected Cash Flow
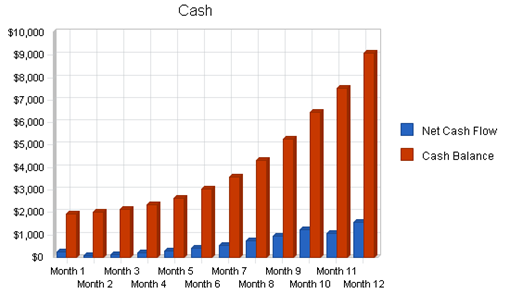
Starting with our initial investment, One Week At A Time plans on always having a positive cash balance and cash flow. Even though some companies suffer from negative cash flow on occasion, we foresee no reason that we should ever be spending more in expenses than we're bringing in from sales.
Our low overhead and initial investment keep us from needing to ever borrow cash or sell off assets to contribute to our cash balance. Our only true fixed expense is website hosting. Any marketing expenses can be trimmed so that we keep our goal of maintaining a positive cash flow and cash balance.
|
Pro Forma Cash Flow |
|||
|
Year 1 |
Year 2 |
Year 3 |
|
|
Cash Received |
|||
|
Cash from Operations |
|||
|
Cash Sales |
$13,621 |
$14,983 |
$16,482 |
|
Subtotal Cash from Operations |
$13,621 |
$14,983 |
$16,482 |
|
Additional Cash Received |
|||
|
Sales Tax, VAT, HST/GST Received |
$0 |
$0 |
$0 |
|
New Current Borrowing |
$0 |
$0 |
$0 |
|
New Other Liabilities (interest-free) |
$0 |
$0 |
$0 |
|
New Long-term Liabilities |
$0 |
$0 |
$0 |
|
Sales of Other Current Assets |
$0 |
$0 |
$0 |
|
Sales of Long-term Assets |
$0 |
$0 |
$0 |
|
New Investment Received |
$0 |
$0 |
$0 |
|
Subtotal Cash Received |
$13,621 |
$14,983 |
$16,482 |
|
Expenditures |
Year 1 |
Year 2 |
Year 3 |
|
Expenditures from Operations |
|||
|
Cash Spending |
$1,000 |
$2,000 |
$4,000 |
|
Bill Payments |
$5,196 |
$6,949 |
$8,023 |
|
Subtotal Spent on Operations |
$6,196 |
$8,949 |
$12,023 |
|
Additional Cash Spent |
|||
|
Sales Tax, VAT, HST/GST Paid Out |
$0 |
$0 |
$0 |
|
Principal Repayment of Current Borrowing |
$0 |
$0 |
$0 |
|
Other Liabilities Principal Repayment |
$0 |
$0 |
$0 |
|
Long-term Liabilities Principal Repayment |
$0 |
$0 |
$0 |
|
Purchase Other Current Assets |
$0 |
$0 |
$0 |
|
Purchase Long-term Assets |
$0 |
$0 |
$0 |
|
Dividends |
$0 |
$0 |
$0 |
|
Subtotal Cash Spent |
$6,196 |
$8,949 |
$12,023 |
|
Net Cash Flow |
$7,425 |
$6,034 |
$4,459 |
|
Cash Balance |
$9,100 |
$15,135 |
$19,594 |
8.6 Projected Balance Sheet
Due to our keeping expenses low and slowly growing our site traffic and sales, the company's net worth will gradually increase over time. We aren't in a race, and have no motivation to try and rush anything and/or spend money frivolously to reach any of our goals.
Our liabilities are very slim, and our sales forecast is conservative so we are more likely to beat these projections than to fail at reaching them.
|
Pro Forma Balance Sheet |
|||
|
Year 1 |
Year 2 |
Year 3 |
|
|
Assets |
|||
|
Current Assets |
|||
|
Cash |
$9,100 |
$15,135 |
$19,594 |
|
Other Current Assets |
$0 |
$0 |
$0 |
|
Total Current Assets |
$9,100 |
$15,135 |
$19,594 |
|
Long-term Assets |
|||
|
Long-term Assets |
$0 |
$0 |
$0 |
|
Accumulated Depreciation |
$0 |
$0 |
$0 |
|
Total Long-term Assets |
$0 |
$0 |
$0 |
|
Total Assets |
$9,100 |
$15,135 |
$19,594 |
|
Liabilities and Capital |
Year 1 |
Year 2 |
Year 3 |
|
Current Liabilities |
|||
|
Accounts Payable |
$933 |
$539 |
$670 |
|
Current Borrowing |
$0 |
$0 |
$0 |
|
Other Current Liabilities |
$0 |
$0 |
$0 |
|
Subtotal Current Liabilities |
$933 |
$539 |
$670 |
|
Long-term Liabilities |
$0 |
$0 |
$0 |
|
Total Liabilities |
$933 |
$539 |
$670 |
|
Paid-in Capital |
$3,000 |
$3,000 |
$3,000 |
|
Retained Earnings |
($1,325) |
$5,168 |
$11,596 |
|
Earnings |
$6,493 |
$6,428 |
$4,327 |
|
Total Capital |
$8,168 |
$14,596 |
$18,923 |
|
Total Liabilities and Capital |
$9,100 |
$15,135 |
$19,594 |
|
Net Worth |
$8,168 |
$14,596 |
$18,923 |
Appendix
|
Sales Forecast |
|||||||||||||
|
Month 1 |
Month 2 |
Month 3 |
Month 4 |
Month 5 |
Month 6 |
Month 7 |
Month 8 |
Month 9 |
Month 10 |
Month 11 |
Month 12 |
||
|
Sales |
|||||||||||||
|
Reusable/Paper Products |
0% |
$25 |
$31 |
$39 |
$49 |
$61 |
$76 |
$95 |
$119 |
$149 |
$186 |
$233 |
$291 |
|
Appliances |
0% |
$50 |
$63 |
$78 |
$98 |
$122 |
$153 |
$191 |
$238 |
$298 |
$373 |
$466 |
$582 |
|
Food |
0% |
$15 |
$17 |
$20 |
$23 |
$26 |
$30 |
$35 |
$40 |
$46 |
$53 |
$61 |
$70 |
|
Clothes/Diapers |
0% |
$50 |
$63 |
$78 |
$98 |
$122 |
$153 |
$191 |
$238 |
$298 |
$373 |
$466 |
$582 |
|
Books/Music |
0% |
$25 |
$30 |
$36 |
$43 |
$52 |
$62 |
$75 |
$90 |
$107 |
$129 |
$155 |
$186 |
|
Kitchen/Cleaners |
0% |
$100 |
$125 |
$156 |
$195 |
$244 |
$305 |
$381 |
$477 |
$596 |
$745 |
$931 |
$1,164 |
|
Total Sales |
$265 |
$329 |
$407 |
$505 |
$627 |
$779 |
$968 |
$1,202 |
$1,494 |
$1,858 |
$2,311 |
$2,875 |
|
|
Direct Cost of Sales |
Month 1 |
Month 2 |
Month 3 |
Month 4 |
Month 5 |
Month 6 |
Month 7 |
Month 8 |
Month 9 |
Month 10 |
Month 11 |
Month 12 |
|
|
Online Marketing |
$50 |
$53 |
$55 |
$58 |
$61 |
$64 |
$67 |
$70 |
$74 |
$78 |
$81 |
$86 |
|
|
Other |
$0 |
$0 |
$0 |
$0 |
$0 |
$0 |
$0 |
$0 |
$0 |
$0 |
$0 |
$0 |
|
|
Subtotal Direct Cost of Sales |
$50 |
$53 |
$55 |
$58 |
$61 |
$64 |
$67 |
$70 |
$74 |
$78 |
$81 |
$86 |
|
|
Personnel Plan |
|||||||||||||
|
Month 1 |
Month 2 |
Month 3 |
Month 4 |
Month 5 |
Month 6 |
Month 7 |
Month 8 |
Month 9 |
Month 10 |
Month 11 |
Month 12 |
||
|
Frank Williams |
0% |
$0 |
$0 |
$0 |
$0 |
$0 |
$0 |
$0 |
$0 |
$0 |
$0 |
$500 |
$500 |
|
Other |
0% |
$0 |
$0 |
$0 |
$0 |
$0 |
$0 |
$0 |
$0 |
$0 |
$0 |
$0 |
$0 |
|
Total People |
1 |
1 |
1 |
1 |
1 |
1 |
1 |
1 |
1 |
1 |
1 |
1 |
|
|
Total Payroll |
$0 |
$0 |
$0 |
$0 |
$0 |
$0 |
$0 |
$0 |
$0 |
$0 |
$500 |
$500 |
|
|
General Assumptions |
|||||||||||||
|
Month 1 |
Month 2 |
Month 3 |
Month 4 |
Month 5 |
Month 6 |
Month 7 |
Month 8 |
Month 9 |
Month 10 |
Month 11 |
Month 12 |
||
|
Plan Month |
1 |
2 |
3 |
4 |
5 |
6 |
7 |
8 |
9 |
10 |
11 |
12 |
|
|
Current Interest Rate |
10.00% |
10.00% |
10.00% |
10.00% |
10.00% |
10.00% |
10.00% |
10.00% |
10.00% |
10.00% |
10.00% |
10.00% |
|
|
Long-term Interest Rate |
10.00% |
10.00% |
10.00% |
10.00% |
10.00% |
10.00% |
10.00% |
10.00% |
10.00% |
10.00% |
10.00% |
10.00% |
|
|
Tax Rate |
30.00% |
30.00% |
30.00% |
30.00% |
30.00% |
30.00% |
30.00% |
30.00% |
30.00% |
30.00% |
30.00% |
30.00% |
|
|
Other |
0 |
0 |
0 |
0 |
0 |
0 |
0 |
0 |
0 |
0 |
0 |
0 |
|
|
Pro Forma Profit and Loss |
|||||||||||||
|
Month 1 |
Month 2 |
Month 3 |
Month 4 |
Month 5 |
Month 6 |
Month 7 |
Month 8 |
Month 9 |
Month 10 |
Month 11 |
Month 12 |
||
|
Sales |
$265 |
$329 |
$407 |
$505 |
$627 |
$779 |
$968 |
$1,202 |
$1,494 |
$1,858 |
$2,311 |
$2,875 |
|
|
Direct Cost of Sales |
$50 |
$53 |
$55 |
$58 |
$61 |
$64 |
$67 |
$70 |
$74 |
$78 |
$81 |
$86 |
|
|
Other Costs of Goods |
$0 |
$0 |
$0 |
$0 |
$0 |
$0 |
$0 |
$0 |
$0 |
$0 |
$0 |
$0 |
|
|
Total Cost of Sales |
$50 |
$53 |
$55 |
$58 |
$61 |
$64 |
$67 |
$70 |
$74 |
$78 |
$81 |
$86 |
|
|
Gross Margin |
$215 |
$276 |
$352 |
$448 |
$567 |
$715 |
$901 |
$1,132 |
$1,421 |
$1,781 |
$2,230 |
$2,789 |
|
|
Gross Margin % |
81.13% |
84.02% |
86.47% |
88.55% |
90.31% |
91.81% |
93.08% |
94.15% |
95.06% |
95.83% |
96.48% |
97.03% |
|
|
Expenses |
|||||||||||||
|
Payroll |
$0 |
$0 |
$0 |
$0 |
$0 |
$0 |
$0 |
$0 |
$0 |
$0 |
$500 |
$500 |
|
|
Sales and Marketing and Other Expenses |
$100 |
$100 |
$100 |
$100 |
$100 |
$100 |
$100 |
$100 |
$100 |
$100 |
$100 |
$100 |
|
|
Depreciation |
$0 |
$0 |
$0 |
$0 |
$0 |
$0 |
$0 |
$0 |
$0 |
$0 |
$0 |
$0 |
|
|
Web Site Hosting |
$100 |
$100 |
$100 |
$100 |
$100 |
$100 |
$100 |
$100 |
$100 |
$100 |
$100 |
$100 |
|
|
Payroll Taxes |
15% |
$0 |
$0 |
$0 |
$0 |
$0 |
$0 |
$0 |
$0 |
$0 |
$0 |
$75 |
$75 |
|
Other |
$0 |
$0 |
$0 |
$0 |
$0 |
$0 |
$0 |
$0 |
$0 |
$0 |
$0 |
$0 |
|
|
Total Operating Expenses |
$200 |
$200 |
$200 |
$200 |
$200 |
$200 |
$200 |
$200 |
$200 |
$200 |
$775 |
$775 |
|
|
Profit Before Interest and Taxes |
$15 |
$76 |
$152 |
$248 |
$367 |
$515 |
$701 |
$932 |
$1,221 |
$1,581 |
$1,455 |
$2,014 |
|
|
EBITDA |
$15 |
$76 |
$152 |
$248 |
$367 |
$515 |
$701 |
$932 |
$1,221 |
$1,581 |
$1,455 |
$2,014 |
|
|
Interest Expense |
$0 |
$0 |
$0 |
$0 |
$0 |
$0 |
$0 |
$0 |
$0 |
$0 |
$0 |
$0 |
|
|
Taxes Incurred |
$5 |
$23 |
$46 |
$74 |
$110 |
$155 |
$210 |
$280 |
$366 |
$474 |
$436 |
$604 |
|
|
Net Profit |
$11 |
$53 |
$107 |
$173 |
$257 |
$361 |
$490 |
$652 |
$854 |
$1,106 |
$1,018 |
$1,410 |
|
|
Net Profit/Sales |
3.96% |
16.19% |
26.16% |
34.29% |
40.90% |
46.29% |
50.68% |
54.26% |
57.17% |
59.54% |
44.06% |
49.05% |
|
|
Pro Forma Cash Flow |
|||||||||||||
|
Month 1 |
Month 2 |
Month 3 |
Month 4 |
Month 5 |
Month 6 |
Month 7 |
Month 8 |
Month 9 |
Month 10 |
Month 11 |
Month 12 |
||
|
Cash Received |
|||||||||||||
|
Cash from Operations |
|||||||||||||
|
Cash Sales |
$265 |
$329 |
$407 |
$505 |
$627 |
$779 |
$968 |
$1,202 |
$1,494 |
$1,858 |
$2,311 |
$2,875 |
|
|
Subtotal Cash from Operations |
$265 |
$329 |
$407 |
$505 |
$627 |
$779 |
$968 |
$1,202 |
$1,494 |
$1,858 |
$2,311 |
$2,875 |
|
|
Additional Cash Received |
|||||||||||||
|
Sales Tax, VAT, HST/GST Received |
0.00% |
$0 |
$0 |
$0 |
$0 |
$0 |
$0 |
$0 |
$0 |
$0 |
$0 |
$0 |
$0 |
|
New Current Borrowing |
$0 |
$0 |
$0 |
$0 |
$0 |
$0 |
$0 |
$0 |
$0 |
$0 |
$0 |
$0 |
|
|
New Other Liabilities (interest-free) |
$0 |
$0 |
$0 |
$0 |
$0 |
$0 |
$0 |
$0 |
$0 |
$0 |
$0 |
$0 |
|
|
New Long-term Liabilities |
$0 |
$0 |
$0 |
$0 |
$0 |
$0 |
$0 |
$0 |
$0 |
$0 |
$0 |
$0 |
|
|
Sales of Other Current Assets |
$0 |
$0 |
$0 |
$0 |
$0 |
$0 |
$0 |
$0 |
$0 |
$0 |
$0 |
$0 |
|
|
Sales of Long-term Assets |
$0 |
$0 |
$0 |
$0 |
$0 |
$0 |
$0 |
$0 |
$0 |
$0 |
$0 |
$0 |
|
|
New Investment Received |
$0 |
$0 |
$0 |
$0 |
$0 |
$0 |
$0 |
$0 |
$0 |
$0 |
$0 |
$0 |
|
|
Subtotal Cash Received |
$265 |
$329 |
$407 |
$505 |
$627 |
$779 |
$968 |
$1,202 |
$1,494 |
$1,858 |
$2,311 |
$2,875 |
|
|
Expenditures |
Month 1 |
Month 2 |
Month 3 |
Month 4 |
Month 5 |
Month 6 |
Month 7 |
Month 8 |
Month 9 |
Month 10 |
Month 11 |
Month 12 |
|
|
Expenditures from Operations |
|||||||||||||
|
Cash Spending |
$0 |
$0 |
$0 |
$0 |
$0 |
$0 |
$0 |
$0 |
$0 |
$0 |
$500 |
$500 |
|
|
Bill Payments |
$8 |
$255 |
$276 |
$302 |
$333 |
$372 |
$420 |
$480 |
$553 |
$644 |
$753 |
$799 |
|
|
Subtotal Spent on Operations |
$8 |
$255 |
$276 |
$302 |
$333 |
$372 |
$420 |
$480 |
$553 |
$644 |
$1,253 |
$1,299 |
|
|
Additional Cash Spent |
|||||||||||||
|
Sales Tax, VAT, HST/GST Paid Out |
$0 |
$0 |
$0 |
$0 |
$0 |
$0 |
$0 |
$0 |
$0 |
$0 |
$0 |
$0 |
|
|
Principal Repayment of Current Borrowing |
$0 |
$0 |
$0 |
$0 |
$0 |
$0 |
$0 |
$0 |
$0 |
$0 |
$0 |
$0 |
|
|
Other Liabilities Principal Repayment |
$0 |
$0 |
$0 |
$0 |
$0 |
$0 |
$0 |
$0 |
$0 |
$0 |
$0 |
$0 |
|
|
Long-term Liabilities Principal Repayment |
$0 |
$0 |
$0 |
$0 |
$0 |
$0 |
$0 |
$0 |
$0 |
$0 |
$0 |
$0 |
|
|
Purchase Other Current Assets |
$0 |
$0 |
$0 |
$0 |
$0 |
$0 |
$0 |
$0 |
$0 |
$0 |
$0 |
$0 |
|
|
Purchase Long-term Assets |
$0 |
$0 |
$0 |
$0 |
$0 |
$0 |
$0 |
$0 |
$0 |
$0 |
$0 |
$0 |
|
|
Dividends |
$0 |
$0 |
$0 |
$0 |
$0 |
$0 |
$0 |
$0 |
$0 |
$0 |
$0 |
$0 |
|
|
Subtotal Cash Spent |
$8 |
$255 |
$276 |
$302 |
$333 |
$372 |
$420 |
$480 |
$553 |
$644 |
$1,253 |
$1,299 |
|
|
Net Cash Flow |
$257 |
$73 |
$131 |
$204 |
$294 |
$407 |
$547 |
$723 |
$942 |
$1,214 |
$1,058 |
$1,576 |
|
|
Cash Balance |
$1,932 |
$2,005 |
$2,136 |
$2,340 |
$2,634 |
$3,040 |
$3,588 |
$4,310 |
$5,252 |
$6,466 |
$7,524 |
$9,100 |
|
|
Pro Forma Balance Sheet |
|||||||||||||
|
Month 1 |
Month 2 |
Month 3 |
Month 4 |
Month 5 |
Month 6 |
Month 7 |
Month 8 |
Month 9 |
Month 10 |
Month 11 |
Month 12 |
||
|
Assets |
Starting Balances |
||||||||||||
|
Current Assets |
|||||||||||||
|
Cash |
$1,675 |
$1,932 |
$2,005 |
$2,136 |
$2,340 |
$2,634 |
$3,040 |
$3,588 |
$4,310 |
$5,252 |
$6,466 |
$7,524 |
$9,100 |
|
Other Current Assets |
$0 |
$0 |
$0 |
$0 |
$0 |
$0 |
$0 |
$0 |
$0 |
$0 |
$0 |
$0 |
$0 |
|
Total Current Assets |
$1,675 |
$1,932 |
$2,005 |
$2,136 |
$2,340 |
$2,634 |
$3,040 |
$3,588 |
$4,310 |
$5,252 |
$6,466 |
$7,524 |
$9,100 |
|
Long-term Assets |
|||||||||||||
|
Long-term Assets |
$0 |
$0 |
$0 |
$0 |
$0 |
$0 |
$0 |
$0 |
$0 |
$0 |
$0 |
$0 |
$0 |
|
Accumulated Depreciation |
$0 |
$0 |
$0 |
$0 |
$0 |
$0 |
$0 |
$0 |
$0 |
$0 |
$0 |
$0 |
$0 |
|
Total Long-term Assets |
$0 |
$0 |
$0 |
$0 |
$0 |
$0 |
$0 |
$0 |
$0 |
$0 |
$0 |
$0 |
$0 |
|
Total Assets |
$1,675 |
$1,932 |
$2,005 |
$2,136 |
$2,340 |
$2,634 |
$3,040 |
$3,588 |
$4,310 |
$5,252 |
$6,466 |
$7,524 |
$9,100 |
|
Liabilities and Capital |
Month 1 |
Month 2 |
Month 3 |
Month 4 |
Month 5 |
Month 6 |
Month 7 |
Month 8 |
Month 9 |
Month 10 |
Month 11 |
Month 12 |
|
|
Current Liabilities |
|||||||||||||
|
Accounts Payable |
$0 |
$246 |
$266 |
$291 |
$321 |
$358 |
$404 |
$461 |
$532 |
$619 |
$727 |
$766 |
$933 |
|
Current Borrowing |
$0 |
$0 |
$0 |
$0 |
$0 |
$0 |
$0 |
$0 |
$0 |
$0 |
$0 |
$0 |
$0 |
|
Other Current Liabilities |
$0 |
$0 |
$0 |
$0 |
$0 |
$0 |
$0 |
$0 |
$0 |
$0 |
$0 |
$0 |
$0 |
|
Subtotal Current Liabilities |
$0 |
$246 |
$266 |
$291 |
$321 |
$358 |
$404 |
$461 |
$532 |
$619 |
$727 |
$766 |
$933 |
|
Long-term Liabilities |
$0 |
$0 |
$0 |
$0 |
$0 |
$0 |
$0 |
$0 |
$0 |
$0 |
$0 |
$0 |
$0 |
|
Total Liabilities |
$0 |
$246 |
$266 |
$291 |
$321 |
$358 |
$404 |
$461 |
$532 |
$619 |
$727 |
$766 |
$933 |
|
Paid-in Capital |
$3,000 |
$3,000 |
$3,000 |
$3,000 |
$3,000 |
$3,000 |
$3,000 |
$3,000 |
$3,000 |
$3,000 |
$3,000 |
$3,000 |
$3,000 |
|
Retained Earnings |
($1,325) |
($1,325) |
($1,325) |
($1,325) |
($1,325) |
($1,325) |
($1,325) |
($1,325) |
($1,325) |
($1,325) |
($1,325) |
($1,325) |
($1,325) |
|
Earnings |
$0 |
$11 |
$64 |
$170 |
$344 |
$600 |
$961 |
$1,451 |
$2,104 |
$2,958 |
$4,065 |
$5,083 |
$6,493 |
|
Total Capital |
$1,675 |
$1,686 |
$1,739 |
$1,845 |
$2,019 |
$2,275 |
$2,636 |
$3,126 |
$3,779 |
$4,633 |
$5,740 |
$6,758 |
$8,168 |
|
Total Liabilities and Capital |
$1,675 |
$1,932 |
$2,005 |
$2,136 |
$2,340 |
$2,634 |
$3,040 |
$3,588 |
$4,310 |
$5,252 |
$6,466 |
$7,524 |
$9,100 |
|
Net Worth |
$1,675 |
$1,686 |
$1,739 |
$1,845 |
$2,019 |
$2,275 |
$2,636 |
$3,126 |
$3,779 |
$4,633 |
$5,740 |
$6,758 |
$8,168 |