Medical Services Management Business Plan
The Medical Group
Executive Summary
The Medical Group (TMG) has been formed to offer management services to doctors in the ever-changing healthcare environment. A unique market opportunity currently presents itself to a few skilled individuals who have both the awareness of this opportunity, and the experience, credibility, and know-how to access this previously-untapped, profitable segment of government health programs.
TMG has identified and begun the numerous tasks necessary to organize these traditional physicians into a management services organization which will enable doctors to:
- Retain their walk-in patients
- Double their current Medicare reimbursement for walk-in patients
- Obtain a contract with Medicare
TMG has been formed to provide services to doctors and provide managed care access via these physicians to Medicare HMOs. The managed care industry, including payors, doctors, and hospitals, have been unaware of the potential walk-in patient population.
There are no companies in the Southern Texas healthcare market capable of accessing the walk-in market. The company has a significant competitive advantage over any future competitors based upon two factors:
- The development of a proprietary database of physicians with large walk-in patient bases in this region.
- The development of a medical group comprised of the leading physicians with the largest walk-in patient bases; TMG has a 20-year management contract with this medical group.
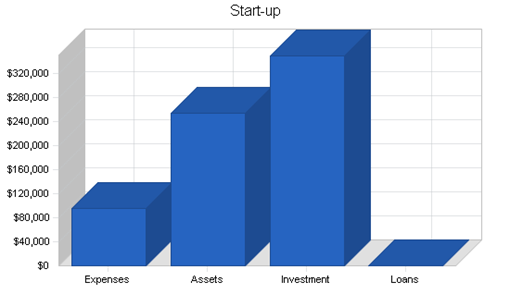
The company projects start-up development costs which will fund an initial development period of approximately 12 months, at this point, profitable operation is expected to be reached.
Company Summary
TMG was founded in July 1999 in Irving, Texas as a management service organization. TMG is a Texas Corporation, with principal offices located in Irving.
|
Start-up Requirements |
|
|
Start-up Expenses |
|
|
Legal |
$2,000 |
|
Stationery etc. |
$2,000 |
|
Sales Materials |
$10,000 |
|
Consultants |
$14,000 |
|
Insurance |
$1,000 |
|
Rent |
$2,000 |
|
Research and development |
$40,000 |
|
Expensed equipment |
$20,000 |
|
Other |
$4,000 |
|
Total Start-up Expenses |
$95,000 |
|
Start-up Assets |
|
|
Cash Required |
$250,000 |
|
Other Current Assets |
$5,000 |
|
Long-term Assets |
$0 |
|
Total Assets |
$255,000 |
|
Total Requirements |
$350,000 |
|
Start-up Funding |
|
|
Start-up Expenses to Fund |
$95,000 |
|
Start-up Assets to Fund |
$255,000 |
|
Total Funding Required |
$350,000 |
|
Assets |
|
|
Non-cash Assets from Start-up |
$5,000 |
|
Cash Requirements from Start-up |
$250,000 |
|
Additional Cash Raised |
$0 |
|
Cash Balance on Starting Date |
$250,000 |
|
Total Assets |
$255,000 |
|
Liabilities and Capital |
|
|
Liabilities |
|
|
Current Borrowing |
$0 |
|
Long-term Liabilities |
$0 |
|
Accounts Payable (Outstanding Bills) |
$0 |
|
Other Current Liabilities (interest-free) |
$0 |
|
Total Liabilities |
$0 |
|
Capital |
|
|
Planned Investment |
|
|
Michael Johnson |
$50,000 |
|
Seed Financing |
$300,000 |
|
Other |
$0 |
|
Additional Investment Requirement |
$0 |
|
Total Planned Investment |
$350,000 |
|
Loss at Start-up (Start-up Expenses) |
($95,000) |
|
Total Capital |
$255,000 |
|
Total Capital and Liabilities |
$255,000 |
|
Total Funding |
$350,000 |
2.1 Mission
The mission of TMG is to provide a management structure that will allow physicians to access more managed care revenue.
2.2 Strategy
TMG's market strategy is to build on its core alliance with the leading group of doctors in Denton County, using the company's expertise in the healthcare industry, along with its unique knowledge of the walk-in market and its extensive experience with managed care payors, regulation, and management.
2.2.1 Strategic Alliances
The company has developed a strategic alliance with medical centers. These alliances are valuable to TMG because these Medicare systems will support development, and because they can also provide, under contract, infrastructure services that will enable TMG to avoid costly infrastructure start-up costs and delays as it moves into operations.
2.3 Risks
The only risk that TMG realistically faces in the marketplace is that of developmental delays, which may extend the period before profitable operations are initiated. To mitigate this risk, TMG has made several conservative assumptions in the development of its operational budget. Operational staff levels are directly related to membership enrollment of walk-in patients. Once operational status is obtained, profits are ensured.
Services
TMG has obtained start-up capital and initiated development activities toward completing a physician network for access to Medicare managed care revenues. TMG believes that they are currently two years ahead of the industry in knowledge and experience.
3.1 Research and Development
TMG, through three years of research, has developed a proprietary and exclusive listing of all physicians in Texas and their walk-in patient volumes. This research and management tool has allowed us to identify and approach several local physicians. It is because of this knowledge that Mr. Johnson is able to obtain initial seed development capital from the hospital system. His knowledge and expertise in this market, and his relationship with key physicians, has been widely recognized by several hospital systems in Southern Texas over the past few years.
3.2 Market Needs
TMG plans to respond to market needs by expanding into additional counties in the near future. In addition, as TMG operations unfold, the utilization of the Internet as a billing mechanism is foreseen. TMG projects that, as a part of its contract for infrastructure services for its development, it will provide Internet activity to its member physicians for cost reductions and ease of operations.
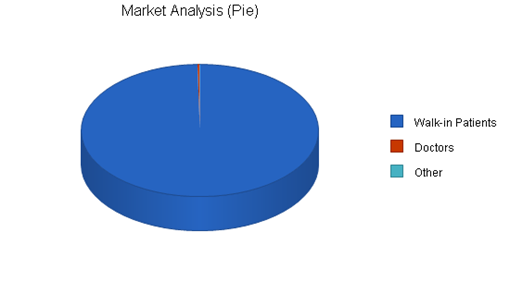
Market Analysis Summary
In 1993, the Texas State Department of Health Services announced the beginning of a process to convert approximately 75% of the over 5 million medical recipients in the state into a healthcare environment. This artificial government interdiction into the healthcare delivery system in Texas has had a significant impact on medical recipients, payors, and most importantly, doctors.
This change, in combination with changes in the Medicare Act, has created an opportunity for TMG to provide a managed care access vehicle to doctors for an extremely profitable portion of the healthcare delivery system, individuals who have both Medicare and Medical health benefits (walk-in).
|
Market Analysis |
|||||||
|
Year 1 |
Year 2 |
Year 3 |
Year 4 |
Year 5 |
|||
|
Potential Customers |
Growth |
CAGR |
|||||
|
Walk-in Patients |
25% |
200,000 |
250,000 |
312,500 |
390,625 |
488,281 |
25.00% |
|
Doctors |
15% |
500 |
575 |
661 |
760 |
874 |
14.98% |
|
Other |
5% |
150 |
158 |
166 |
174 |
183 |
5.10% |
|
Total |
24.97% |
200,650 |
250,733 |
313,327 |
391,559 |
489,338 |
24.97% |
4.1 Market Description
The managed care industry is a vital component of the healthcare delivery system of the United States. Its component parts are payors (HMOs), physicians (managed care entities such as IPAs and MSOs), hospitals, and other providers.
4.2 Market Size
In Denton County there are over 300,000 individuals with both Medicare and Medical coverage (walk-in). In the five Southern Texas Counties (Denton, Garland, Dallas, Plano, and Memphis), there are 330,000 walk-in, and in the whole state, there are 650,000 walk-in. In Denton, there are 436,000 Medicare recipients. Currently 17% of those recipients are in Medicare HMOs and approximately 592,000 are not. Of this 592,000, approximately one third (1/3) are walk-in. In the State of Texas, there are 1.8 million Medicare recipients with 27.22% currently in HMOs. That leaves 1.5 million Medicare members still not in HMO's. Walk-ins are one third (1/3) of that total, or 650,000 eligible.
4.3 Customers and Target Markets
Doctors and the walk-in market
In Denton County there are approximately 1.8 million medical recipients, of whom, more than 200,000 are walk-in patients, or individuals who have both Medical and Medicare.
In Denton County alone there are over 330 physicians who fall into the category of doctors with more than 100 walk-in patients in their practice base. This group, which incorporated in the spring of 1999, has as its key officers physicians with walk-in patient levels in excess of 500.
Competitive Analysis
Currently, TMG does not believe there are any competitive threats to its development and penetration of the walk-in market in Southern Texas. That assessment is based upon the following factors.
5.1 Competitive Edge
TMG enjoys a significant competitive advantage over any entity who would attempt to penetrate the walk-in market.
- Extensive customer list
- Qualified management team
- In-depth knowledge of the industry
- Solid business partnerships
Strategy and Implementation Summary
The company plans to use the Internet as one of its primary marketing channels. The Internet is a growing force in the buying and selling of a wide variety of products, including medical services. According to International Data Corporation (IDC), a leading provider of information technology data, aggregate Internet commerce across all industries was estimated to have been $32 billion in 1998, and is projected to soar to $425 billion by 2002.
The Internet provides a relatively easy way to gather information and to shop for the best deals, in terms of both price and needed attributes. Through websites, consumers can read a variety of reviews to compare models and see which vehicles meet their needs. They can view, search, and screen for prices, features, and other important information. For retailers, the Internet is a means of increasing volume through leads that are converted into sales and a means of decreasing marketing, advertising, and personnel costs per sale.
|
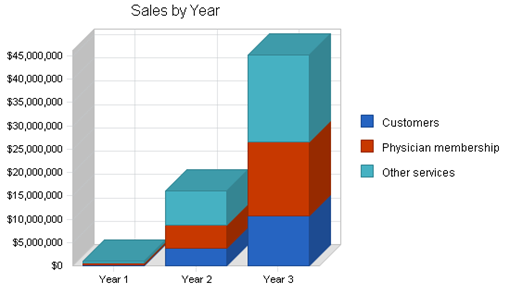
Sales Forecast |
|||
|
Year 1 |
Year 2 |
Year 3 |
|
|
Sales |
|||
|
Customers |
$250,000 |
$3,750,000 |
$10,750,000 |
|
Physician membership |
$325,000 |
$4,875,000 |
$15,875,000 |
|
Other services |
$500,000 |
$7,500,000 |
$18,500,000 |
|
Total Sales |
$1,075,000 |
$16,125,000 |
$45,125,000 |
|
Direct Cost of Sales |
Year 1 |
Year 2 |
Year 3 |
|
Customers |
$33,330 |
$500,000 |
$1,102,564 |
|
Physician membership |
$0 |
$0 |
$0 |
|
Other services |
$66,670 |
$1,000,000 |
$1,897,436 |
|
Subtotal Direct Cost of Sales |
$100,000 |
$1,500,000 |
$3,000,000 |
6.1 Marketing Communications
The key message associated with TMG's services are affordability and reliability for customers. TMG believes that it can achieve success through the implementation of a new promotional plan. The company's new promotional plan is diverse and includes a range of marketing:
- Print advertising. The company's print advertising program includes advertisements in the Irving News Express and the military newspaper distributed by Prime Time News.
- Internet. TMG plans to develop a website through which it will generate sales beyond Denton County. Plans are underway to develop a professional and effective site. In the future, this is expected to be one of the company's primary marketing channels.
- Television and Radio. The company plans to expand its promotions into television advertising. Currently, a number of local radio stations have been used for advertising purposes. The company intends to use additional radio stations that have listener bases that includes more of its target customers.
- Industry journals. The company plans on advertising in medical journals, local magazines that dedicated to the medical industry.
· Management Summary
· The company's management philosophy will be based on responsibility and mutual respect. TMG will maintain an environment and structure that will encourage productivity and respect for customers and fellow employees. Additionally, the environment will encourage employees to have fun by allowing creative independence and providing challenges that are realistic and rewarding.
· TMG's management is highly experienced and qualified. Key members of TMG's management teams, their backgrounds, and responsibilities are as follows.
· Mr. Michael Johnson, President and CEO.
· Note: Background has been removed for confidentiality.
· Board of Advisors
· It is TMG's intent to utilize the extensive contacts that Mr. Johnson has in the Southern Texas market in terms of an Advisory Board to TMG and its owners. As TMG develops, depending upon which hospital systems are utilized to the greatest amount, other healthcare delivery executives will be invited to participate in the Board of Advisors.
·
|
Personnel Plan |
|||
|
Year 1 |
Year 2 |
Year 3 |
|
|
All Staff |
$256,522 |
$453,066 |
$608,696 |
|
Other |
$0 |
$0 |
$0 |
|
Total People |
7 |
9 |
13 |
|
Total Payroll |
$256,522 |
$453,066 |
$608,696 |
Financial Plan
The company is raising funding to complete development through Year 2 of operation.
8.1 Important Assumptions
The following table presents some assumptions that are necessary to the success of TMG.
|
General Assumptions |
|||
|
Year 1 |
Year 2 |
Year 3 |
|
|
Plan Month |
1 |
2 |
3 |
|
Current Interest Rate |
10.00% |
10.00% |
10.00% |
|
Long-term Interest Rate |
10.00% |
10.00% |
10.00% |
|
Tax Rate |
25.42% |
25.00% |
25.42% |
|
Other |
0 |
0 |
0 |
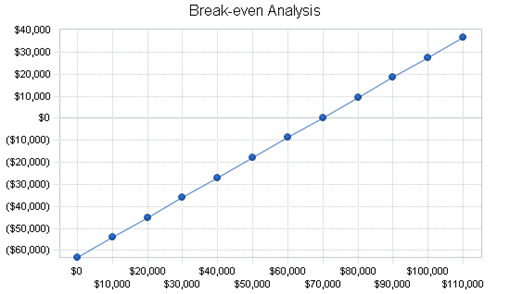
8.2 Break-even Analysis
The chart and table below outline present the Break-even Analysis for TMG.
|
Break-even Analysis |
|
|
Monthly Revenue Break-even |
$69,700 |
|
Assumptions: |
|
|
Average Percent Variable Cost |
9% |
|
Estimated Monthly Fixed Cost |
$63,217 |
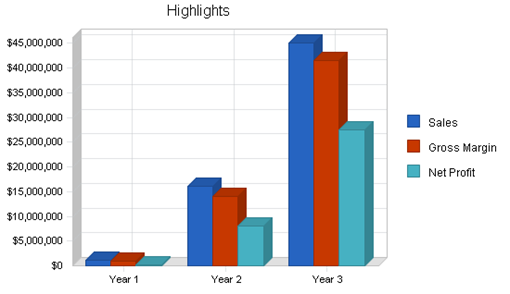
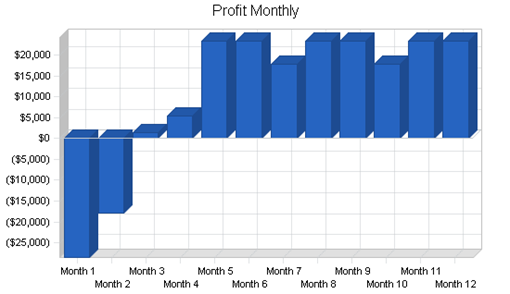
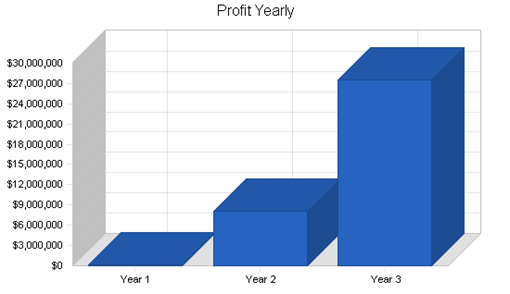
8.3 Projected Profit and Loss
The company is in the early stage of development, thus initial projections have only been made on accounts that are believed to most drive the income statement.
|
Pro Forma Profit and Loss |
|||
|
Year 1 |
Year 2 |
Year 3 |
|
|
Sales |
$1,075,000 |
$16,125,000 |
$45,125,000 |
|
Direct Cost of Sales |
$100,000 |
$1,500,000 |
$3,000,000 |
|
Other |
$38,000 |
$570,000 |
$600,000 |
|
Total Cost of Sales |
$138,000 |
$2,070,000 |
$3,600,000 |
|
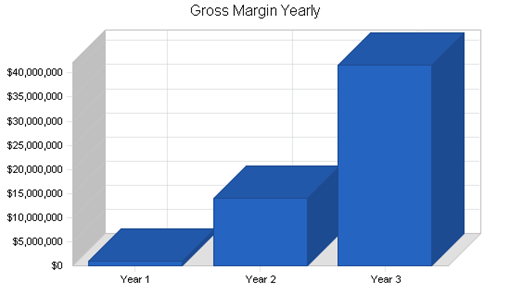
Gross Margin |
$937,000 |
$14,055,000 |
$41,525,000 |
|
Gross Margin % |
87.16% |
87.16% |
92.02% |
|
Expenses |
|||
|
Payroll |
$256,522 |
$453,066 |
$608,696 |
|
Sales and Marketing and Other Expenses |
$382,000 |
$2,163,810 |
$3,366,850 |
|
Depreciation |
$8,400 |
$0 |
$0 |
|
Continued education |
$36,000 |
$517,500 |
$575,500 |
|
Utilities |
$3,600 |
$4,000 |
$4,500 |
|
Insurance |
$9,600 |
$20,000 |
$25,000 |
|
Rent |
$24,000 |
$25,000 |
$25,000 |
|
Payroll Taxes |
$38,478 |
$67,960 |
$91,304 |
|
Other |
$0 |
$0 |
$0 |
|
Total Operating Expenses |
$758,600 |
$3,251,336 |
$4,696,850 |
|
Profit Before Interest and Taxes |
$178,400 |
$10,803,664 |
$36,828,150 |
|
EBITDA |
$186,800 |
$10,803,664 |
$36,828,150 |
|
Interest Expense |
$0 |
$0 |
$0 |
|
Taxes Incurred |
$42,564 |
$2,700,916 |
$9,360,488 |
|
Net Profit |
$135,835 |
$8,102,748 |
$27,467,662 |
|
Net Profit/Sales |
12.64% |
50.25% |
60.87% |
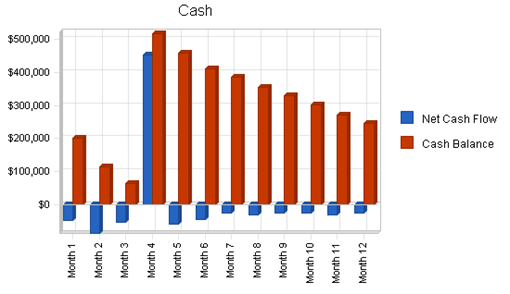
8.4 Projected Cash Flow
The cash flow projections are presented in the following chart and table.
|
Pro Forma Cash Flow |
|||
|
Year 1 |
Year 2 |
Year 3 |
|
|
Cash Received |
|||
|
Cash from Operations |
|||
|
Cash Sales |
$0 |
$0 |
$0 |
|
Cash from Receivables |
$868,500 |
$13,234,000 |
$39,554,302 |
|
Subtotal Cash from Operations |
$868,500 |
$13,234,000 |
$39,554,302 |
|
Additional Cash Received |
|||
|
Sales Tax, VAT, HST/GST Received |
$0 |
$0 |
$0 |
|
New Current Borrowing |
$0 |
$0 |
$0 |
|
New Other Liabilities (interest-free) |
$0 |
$0 |
$0 |
|
New Long-term Liabilities |
$0 |
$0 |
$0 |
|
Sales of Other Current Assets |
$0 |
$0 |
$0 |
|
Sales of Long-term Assets |
$0 |
$0 |
$0 |
|
New Investment Received |
$500,000 |
$0 |
$0 |
|
Subtotal Cash Received |
$1,368,500 |
$13,234,000 |
$39,554,302 |
|
Expenditures |
Year 1 |
Year 2 |
Year 3 |
|
Expenditures from Operations |
|||
|
Cash Spending |
$256,522 |
$453,066 |
$608,696 |
|
Bill Payments |
$616,643 |
$7,004,661 |
$16,269,509 |
|
Subtotal Spent on Operations |
$873,165 |
$7,457,727 |
$16,878,205 |
|
Additional Cash Spent |
|||
|
Sales Tax, VAT, HST/GST Paid Out |
$0 |
$0 |
$0 |
|
Principal Repayment of Current Borrowing |
$0 |
$0 |
$0 |
|
Other Liabilities Principal Repayment |
$0 |
$0 |
$0 |
|
Long-term Liabilities Principal Repayment |
$0 |
$0 |
$0 |
|
Purchase Other Current Assets |
$0 |
$0 |
$0 |
|
Purchase Long-term Assets |
$500,000 |
$2,000,000 |
$8,000,000 |
|
Dividends |
$0 |
$0 |
$0 |
|
Subtotal Cash Spent |
$1,373,165 |
$9,457,727 |
$24,878,205 |
|
Net Cash Flow |
($4,665) |
$3,776,273 |
$14,676,097 |
|
Cash Balance |
$245,335 |
$4,021,608 |
$18,697,706 |
8.5 Projected Balance Sheet
The table below provides TMG's projected balance sheet for 2000-2002.
|
Pro Forma Balance Sheet |
|||
|
Year 1 |
Year 2 |
Year 3 |
|
|
Assets |
|||
|
Current Assets |
|||
|
Cash |
$245,335 |
$4,021,608 |
$18,697,706 |
|
Accounts Receivable |
$206,500 |
$3,097,500 |
$8,668,198 |
|
Other Current Assets |
$5,000 |
$5,000 |
$5,000 |
|
Total Current Assets |
$456,835 |
$7,124,108 |
$27,370,903 |
|
Long-term Assets |
|||
|
Long-term Assets |
$500,000 |
$2,500,000 |
$10,500,000 |
|
Accumulated Depreciation |
$8,400 |
$8,400 |
$8,400 |
|
Total Long-term Assets |
$491,600 |
$2,491,600 |
$10,491,600 |
|
Total Assets |
$948,435 |
$9,615,708 |
$37,862,503 |
|
Liabilities and Capital |
Year 1 |
Year 2 |
Year 3 |
|
Current Liabilities |
|||
|
Accounts Payable |
$57,599 |
$622,125 |
$1,401,258 |
|
Current Borrowing |
$0 |
$0 |
$0 |
|
Other Current Liabilities |
$0 |
$0 |
$0 |
|
Subtotal Current Liabilities |
$57,599 |
$622,125 |
$1,401,258 |
|
Long-term Liabilities |
$0 |
$0 |
$0 |
|
Total Liabilities |
$57,599 |
$622,125 |
$1,401,258 |
|
Paid-in Capital |
$850,000 |
$850,000 |
$850,000 |
|
Retained Earnings |
($95,000) |
$40,835 |
$8,143,584 |
|
Earnings |
$135,835 |
$8,102,748 |
$27,467,662 |
|
Total Capital |
$890,835 |
$8,993,584 |
$36,461,245 |
|
Total Liabilities and Capital |
$948,435 |
$9,615,708 |
$37,862,503 |
|
Net Worth |
$890,835 |
$8,993,584 |
$36,461,245 |
8.6 Business Ratios
The following table contains important business ratios for the offices and clinics of medical doctors industry, as determined by the Standard Industry Classification (SIC) Index code 8011, Offices & Clinics of Medical Doctors.
|
Ratio Analysis |
||||
|
Year 1 |
Year 2 |
Year 3 |
Industry Profile |
|
|
Sales Growth |
0.00% |
1400.00% |
179.84% |
5.90% |
|
Percent of Total Assets |
||||
|
Accounts Receivable |
21.77% |
32.21% |
22.89% |
10.00% |
|
Other Current Assets |
0.53% |
0.05% |
0.01% |
50.50% |
|
Total Current Assets |
48.17% |
74.09% |
72.29% |
60.80% |
|
Long-term Assets |
51.83% |
25.91% |
27.71% |
39.20% |
|
Total Assets |
100.00% |
100.00% |
100.00% |
100.00% |
|
Current Liabilities |
6.07% |
6.47% |
3.70% |
39.80% |
|
Long-term Liabilities |
0.00% |
0.00% |
0.00% |
14.10% |
|
Total Liabilities |
6.07% |
6.47% |
3.70% |
53.90% |
|
Net Worth |
93.93% |
93.53% |
96.30% |
46.10% |
|
Percent of Sales |
||||
|
Sales |
100.00% |
100.00% |
100.00% |
100.00% |
|
Gross Margin |
87.16% |
87.16% |
92.02% |
0.00% |
|
Selling, General & Administrative Expenses |
74.72% |
36.91% |
30.81% |
57.10% |
|
Advertising Expenses |
6.14% |
6.05% |
2.77% |
0.40% |
|
Profit Before Interest and Taxes |
16.60% |
67.00% |
81.61% |
2.00% |
|
Main Ratios |
||||
|
Current |
7.93 |
11.45 |
19.53 |
1.37 |
|
Quick |
7.93 |
11.45 |
19.53 |
1.12 |
|
Total Debt to Total Assets |
6.07% |
6.47% |
3.70% |
53.90% |
|
Pre-tax Return on Net Worth |
20.03% |
120.13% |
101.01% |
6.90% |
|
Pre-tax Return on Assets |
18.81% |
112.35% |
97.27% |
15.00% |
|
Additional Ratios |
Year 1 |
Year 2 |
Year 3 |
|
|
Net Profit Margin |
12.64% |
50.25% |
60.87% |
n.a |
|
Return on Equity |
15.25% |
90.09% |
75.33% |
n.a |
|
Activity Ratios |
||||
|
Accounts Receivable Turnover |
5.21 |
5.21 |
5.21 |
n.a |
|
Collection Days |
57 |
37 |
48 |
n.a |
|
Accounts Payable Turnover |
11.71 |
12.17 |
12.17 |
n.a |
|
Payment Days |
27 |
16 |
22 |
n.a |
|
Total Asset Turnover |
1.13 |
1.68 |
1.19 |
n.a |
|
Debt Ratios |
||||
|
Debt to Net Worth |
0.06 |
0.07 |
0.04 |
n.a |
|
Current Liab. to Liab. |
1.00 |
1.00 |
1.00 |
n.a |
|
Liquidity Ratios |
||||
|
Net Working Capital |
$399,235 |
$6,501,984 |
$25,969,645 |
n.a |
|
Interest Coverage |
0.00 |
0.00 |
0.00 |
n.a |
|
Additional Ratios |
||||
|
Assets to Sales |
0.88 |
0.60 |
0.84 |
n.a |
|
Current Debt/Total Assets |
6% |
6% |
4% |
n.a |
|
Acid Test |
4.35 |
6.47 |
13.35 |
n.a |
|
Sales/Net Worth |
1.21 |
1.79 |
1.24 |
n.a |
|
Dividend Payout |
0.00 |
0.00 |
0.00 |
n.a |
Appendix
|
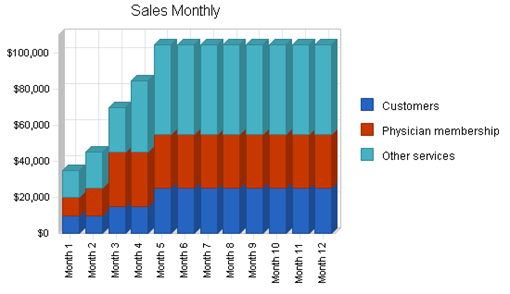
Sales Forecast |
|||||||||||||
|
Month 1 |
Month 2 |
Month 3 |
Month 4 |
Month 5 |
Month 6 |
Month 7 |
Month 8 |
Month 9 |
Month 10 |
Month 11 |
Month 12 |
||
|
Sales |
|||||||||||||
|
Customers |
0% |
$10,000 |
$10,000 |
$15,000 |
$15,000 |
$25,000 |
$25,000 |
$25,000 |
$25,000 |
$25,000 |
$25,000 |
$25,000 |
$25,000 |
|
Physician membership |
0% |
$10,000 |
$15,000 |
$30,000 |
$30,000 |
$30,000 |
$30,000 |
$30,000 |
$30,000 |
$30,000 |
$30,000 |
$30,000 |
$30,000 |
|
Other services |
0% |
$15,000 |
$20,000 |
$25,000 |
$40,000 |
$50,000 |
$50,000 |
$50,000 |
$50,000 |
$50,000 |
$50,000 |
$50,000 |
$50,000 |
|
Total Sales |
$35,000 |
$45,000 |
$70,000 |
$85,000 |
$105,000 |
$105,000 |
$105,000 |
$105,000 |
$105,000 |
$105,000 |
$105,000 |
$105,000 |
|
|
Direct Cost of Sales |
Month 1 |
Month 2 |
Month 3 |
Month 4 |
Month 5 |
Month 6 |
Month 7 |
Month 8 |
Month 9 |
Month 10 |
Month 11 |
Month 12 |
|
|
Customers |
$1,333 |
$1,333 |
$2,000 |
$2,000 |
$3,333 |
$3,333 |
$3,333 |
$3,333 |
$3,333 |
$3,333 |
$3,333 |
$3,333 |
|
|
Physician membership |
$0 |
$0 |
$0 |
$0 |
$0 |
$0 |
$0 |
$0 |
$0 |
$0 |
$0 |
$0 |
|
|
Other services |
$2,000 |
$2,667 |
$3,333 |
$5,334 |
$6,667 |
$6,667 |
$6,667 |
$6,667 |
$6,667 |
$6,667 |
$6,667 |
$6,667 |
|
|
Subtotal Direct Cost of Sales |
$3,333 |
$4,000 |
$5,333 |
$7,334 |
$10,000 |
$10,000 |
$10,000 |
$10,000 |
$10,000 |
$10,000 |
$10,000 |
$10,000 |
|
|
Personnel Plan |
|||||||||||||
|
Month 1 |
Month 2 |
Month 3 |
Month 4 |
Month 5 |
Month 6 |
Month 7 |
Month 8 |
Month 9 |
Month 10 |
Month 11 |
Month 12 |
||
|
All Staff |
0% |
$21,375 |
$21,377 |
$21,377 |
$21,377 |
$21,377 |
$21,377 |
$21,377 |
$21,377 |
$21,377 |
$21,377 |
$21,377 |
$21,377 |
|
Other |
0% |
$0 |
$0 |
$0 |
$0 |
$0 |
$0 |
$0 |
$0 |
$0 |
$0 |
$0 |
$0 |
|
Total People |
7 |
7 |
7 |
7 |
7 |
7 |
7 |
7 |
7 |
7 |
7 |
7 |
|
|
Total Payroll |
$21,375 |
$21,377 |
$21,377 |
$21,377 |
$21,377 |
$21,377 |
$21,377 |
$21,377 |
$21,377 |
$21,377 |
$21,377 |
$21,377 |
|
|
General Assumptions |
|||||||||||||
|
Month 1 |
Month 2 |
Month 3 |
Month 4 |
Month 5 |
Month 6 |
Month 7 |
Month 8 |
Month 9 |
Month 10 |
Month 11 |
Month 12 |
||
|
Plan Month |
1 |
2 |
3 |
4 |
5 |
6 |
7 |
8 |
9 |
10 |
11 |
12 |
|
|
Current Interest Rate |
10.00% |
10.00% |
10.00% |
10.00% |
10.00% |
10.00% |
10.00% |
10.00% |
10.00% |
10.00% |
10.00% |
10.00% |
|
|
Long-term Interest Rate |
10.00% |
10.00% |
10.00% |
10.00% |
10.00% |
10.00% |
10.00% |
10.00% |
10.00% |
10.00% |
10.00% |
10.00% |
|
|
Tax Rate |
30.00% |
25.00% |
25.00% |
25.00% |
25.00% |
25.00% |
25.00% |
25.00% |
25.00% |
25.00% |
25.00% |
25.00% |
|
|
Other |
0 |
0 |
0 |
0 |
0 |
0 |
0 |
0 |
0 |
0 |
0 |
0 |
|
|
Pro Forma Profit and Loss |
|||||||||||||
|
Month 1 |
Month 2 |
Month 3 |
Month 4 |
Month 5 |
Month 6 |
Month 7 |
Month 8 |
Month 9 |
Month 10 |
Month 11 |
Month 12 |
||
|
Sales |
$35,000 |
$45,000 |
$70,000 |
$85,000 |
$105,000 |
$105,000 |
$105,000 |
$105,000 |
$105,000 |
$105,000 |
$105,000 |
$105,000 |
|
|
Direct Cost of Sales |
$3,333 |
$4,000 |
$5,333 |
$7,334 |
$10,000 |
$10,000 |
$10,000 |
$10,000 |
$10,000 |
$10,000 |
$10,000 |
$10,000 |
|
|
Other |
$2,500 |
$2,500 |
$2,500 |
$2,500 |
$3,500 |
$3,500 |
$3,500 |
$3,500 |
$3,500 |
$3,500 |
$3,500 |
$3,500 |
|
|
Total Cost of Sales |
$5,833 |
$6,500 |
$7,833 |
$9,834 |
$13,500 |
$13,500 |
$13,500 |
$13,500 |
$13,500 |
$13,500 |
$13,500 |
$13,500 |
|
|
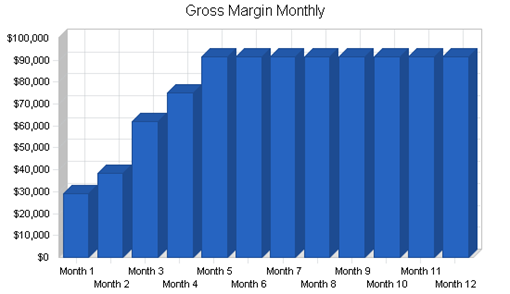
Gross Margin |
$29,167 |
$38,500 |
$62,167 |
$75,166 |
$91,500 |
$91,500 |
$91,500 |
$91,500 |
$91,500 |
$91,500 |
$91,500 |
$91,500 |
|
|
Gross Margin % |
83.33% |
85.56% |
88.81% |
88.43% |
87.14% |
87.14% |
87.14% |
87.14% |
87.14% |
87.14% |
87.14% |
87.14% |
|
|
Expenses |
|||||||||||||
|
Payroll |
$21,375 |
$21,377 |
$21,377 |
$21,377 |
$21,377 |
$21,377 |
$21,377 |
$21,377 |
$21,377 |
$21,377 |
$21,377 |
$21,377 |
|
|
Sales and Marketing and Other Expenses |
$38,500 |
$31,000 |
$29,000 |
$36,500 |
$29,000 |
$29,000 |
$36,500 |
$29,000 |
$29,000 |
$36,500 |
$29,000 |
$29,000 |
|
|
Depreciation |
$700 |
$700 |
$700 |
$700 |
$700 |
$700 |
$700 |
$700 |
$700 |
$700 |
$700 |
$700 |
|
|
Continued education |
$3,000 |
$3,000 |
$3,000 |
$3,000 |
$3,000 |
$3,000 |
$3,000 |
$3,000 |
$3,000 |
$3,000 |
$3,000 |
$3,000 |
|
|
Utilities |
$300 |
$300 |
$300 |
$300 |
$300 |
$300 |
$300 |
$300 |
$300 |
$300 |
$300 |
$300 |
|
|
Insurance |
$800 |
$800 |
$800 |
$800 |
$800 |
$800 |
$800 |
$800 |
$800 |
$800 |
$800 |
$800 |
|
|
Rent |
$2,000 |
$2,000 |
$2,000 |
$2,000 |
$2,000 |
$2,000 |
$2,000 |
$2,000 |
$2,000 |
$2,000 |
$2,000 |
$2,000 |
|
|
Payroll Taxes |
15% |
$3,206 |
$3,207 |
$3,207 |
$3,207 |
$3,207 |
$3,207 |
$3,207 |
$3,207 |
$3,207 |
$3,207 |
$3,207 |
$3,207 |
|
Other |
$0 |
$0 |
$0 |
$0 |
$0 |
$0 |
$0 |
$0 |
$0 |
$0 |
$0 |
$0 |
|
|
Total Operating Expenses |
$69,881 |
$62,384 |
$60,384 |
$67,884 |
$60,384 |
$60,384 |
$67,884 |
$60,384 |
$60,384 |
$67,884 |
$60,384 |
$60,384 |
|
|
Profit Before Interest and Taxes |
($40,714) |
($23,884) |
$1,783 |
$7,282 |
$31,116 |
$31,116 |
$23,616 |
$31,116 |
$31,116 |
$23,616 |
$31,116 |
$31,116 |
|
|
EBITDA |
($40,014) |
($23,184) |
$2,483 |
$7,982 |
$31,816 |
$31,816 |
$24,316 |
$31,816 |
$31,816 |
$24,316 |
$31,816 |
$31,816 |
|
|
Interest Expense |
$0 |
$0 |
$0 |
$0 |
$0 |
$0 |
$0 |
$0 |
$0 |
$0 |
$0 |
$0 |
|
|
Taxes Incurred |
($12,214) |
($5,971) |
$446 |
$1,821 |
$7,779 |
$7,779 |
$5,904 |
$7,779 |
$7,779 |
$5,904 |
$7,779 |
$7,779 |
|
|
Net Profit |
($28,500) |
($17,913) |
$1,338 |
$5,462 |
$23,337 |
$23,337 |
$17,712 |
$23,337 |
$23,337 |
$17,712 |
$23,337 |
$23,337 |
|
|
Net Profit/Sales |
-81.43% |
-39.81% |
1.91% |
6.43% |
22.23% |
22.23% |
16.87% |
22.23% |
22.23% |
16.87% |
22.23% |
22.23% |
|
|
Pro Forma Cash Flow |
|||||||||||||
|
Month 1 |
Month 2 |
Month 3 |
Month 4 |
Month 5 |
Month 6 |
Month 7 |
Month 8 |
Month 9 |
Month 10 |
Month 11 |
Month 12 |
||
|
Cash Received |
|||||||||||||
|
Cash from Operations |
|||||||||||||
|
Cash Sales |
$0 |
$0 |
$0 |
$0 |
$0 |
$0 |
$0 |
$0 |
$0 |
$0 |
$0 |
$0 |
|
|
Cash from Receivables |
$0 |
$1,167 |
$35,333 |
$45,833 |
$70,500 |
$85,667 |
$105,000 |
$105,000 |
$105,000 |
$105,000 |
$105,000 |
$105,000 |
|
|
Subtotal Cash from Operations |
$0 |
$1,167 |
$35,333 |
$45,833 |
$70,500 |
$85,667 |
$105,000 |
$105,000 |
$105,000 |
$105,000 |
$105,000 |
$105,000 |
|
|
Additional Cash Received |
|||||||||||||
|
Sales Tax, VAT, HST/GST Received |
0.00% |
$0 |
$0 |
$0 |
$0 |
$0 |
$0 |
$0 |
$0 |
$0 |
$0 |
$0 |
$0 |
|
New Current Borrowing |
$0 |
$0 |
$0 |
$0 |
$0 |
$0 |
$0 |
$0 |
$0 |
$0 |
$0 |
$0 |
|
|
New Other Liabilities (interest-free) |
$0 |
$0 |
$0 |
$0 |
$0 |
$0 |
$0 |
$0 |
$0 |
$0 |
$0 |
$0 |
|
|
New Long-term Liabilities |
$0 |
$0 |
$0 |
$0 |
$0 |
$0 |
$0 |
$0 |
$0 |
$0 |
$0 |
$0 |
|
|
Sales of Other Current Assets |
$0 |
$0 |
$0 |
$0 |
$0 |
$0 |
$0 |
$0 |
$0 |
$0 |
$0 |
$0 |
|
|
Sales of Long-term Assets |
$0 |
$0 |
$0 |
$0 |
$0 |
$0 |
$0 |
$0 |
$0 |
$0 |
$0 |
$0 |
|
|
New Investment Received |
$0 |
$0 |
$0 |
$500,000 |
$0 |
$0 |
$0 |
$0 |
$0 |
$0 |
$0 |
$0 |
|
|
Subtotal Cash Received |
$0 |
$1,167 |
$35,333 |
$545,833 |
$70,500 |
$85,667 |
$105,000 |
$105,000 |
$105,000 |
$105,000 |
$105,000 |
$105,000 |
|
|
Expenditures |
Month 1 |
Month 2 |
Month 3 |
Month 4 |
Month 5 |
Month 6 |
Month 7 |
Month 8 |
Month 9 |
Month 10 |
Month 11 |
Month 12 |
|
|
Expenditures from Operations |
|||||||||||||
|
Cash Spending |
$21,375 |
$21,377 |
$21,377 |
$21,377 |
$21,377 |
$21,377 |
$21,377 |
$21,377 |
$21,377 |
$21,377 |
$21,377 |
$21,377 |
|
|
Bill Payments |
$1,381 |
$41,405 |
$41,027 |
$46,948 |
$57,532 |
$59,586 |
$59,773 |
$65,023 |
$59,586 |
$59,773 |
$65,023 |
$59,586 |
|
|
Subtotal Spent on Operations |
$22,756 |
$62,782 |
$62,404 |
$68,325 |
$78,909 |
$80,963 |
$81,150 |
$86,400 |
$80,963 |
$81,150 |
$86,400 |
$80,963 |
|
|
Additional Cash Spent |
|||||||||||||
|
Sales Tax, VAT, HST/GST Paid Out |
$0 |
$0 |
$0 |
$0 |
$0 |
$0 |
$0 |
$0 |
$0 |
$0 |
$0 |
$0 |
|
|
Principal Repayment of Current Borrowing |
$0 |
$0 |
$0 |
$0 |
$0 |
$0 |
$0 |
$0 |
$0 |
$0 |
$0 |
$0 |
|
|
Other Liabilities Principal Repayment |
$0 |
$0 |
$0 |
$0 |
$0 |
$0 |
$0 |
$0 |
$0 |
$0 |
$0 |
$0 |
|
|
Long-term Liabilities Principal Repayment |
$0 |
$0 |
$0 |
$0 |
$0 |
$0 |
$0 |
$0 |
$0 |
$0 |
$0 |
$0 |
|
|
Purchase Other Current Assets |
$0 |
$0 |
$0 |
$0 |
$0 |
$0 |
$0 |
$0 |
$0 |
$0 |
$0 |
$0 |
|
|
Purchase Long-term Assets |
$25,000 |
$25,000 |
$25,000 |
$25,000 |
$50,000 |
$50,000 |
$50,000 |
$50,000 |
$50,000 |
$50,000 |
$50,000 |
$50,000 |
|
|
Dividends |
$0 |
$0 |
$0 |
$0 |
$0 |
$0 |
$0 |
$0 |
$0 |
$0 |
$0 |
$0 |
|
|
Subtotal Cash Spent |
$47,756 |
$87,782 |
$87,404 |
$93,325 |
$128,909 |
$130,963 |
$131,150 |
$136,400 |
$130,963 |
$131,150 |
$136,400 |
$130,963 |
|
|
Net Cash Flow |
($47,756) |
($86,616) |
($52,071) |
$452,508 |
($58,409) |
($45,296) |
($26,150) |
($31,400) |
($25,963) |
($26,150) |
($31,400) |
($25,963) |
|
|
Cash Balance |
$202,244 |
$115,629 |
$63,558 |
$516,066 |
$457,657 |
$412,361 |
$386,211 |
$354,811 |
$328,848 |
$302,698 |
$271,298 |
$245,335 |
|
|
Pro Forma Balance Sheet |
|||||||||||||
|
Month 1 |
Month 2 |
Month 3 |
Month 4 |
Month 5 |
Month 6 |
Month 7 |
Month 8 |
Month 9 |
Month 10 |
Month 11 |
Month 12 |
||
|
Assets |
Starting Balances |
||||||||||||
|
Current Assets |
|||||||||||||
|
Cash |
$250,000 |
$202,244 |
$115,629 |
$63,558 |
$516,066 |
$457,657 |
$412,361 |
$386,211 |
$354,811 |
$328,848 |
$302,698 |
$271,298 |
$245,335 |
|
Accounts Receivable |
$0 |
$35,000 |
$78,833 |
$113,500 |
$152,667 |
$187,167 |
$206,500 |
$206,500 |
$206,500 |
$206,500 |
$206,500 |
$206,500 |
$206,500 |
|
Other Current Assets |
$5,000 |
$5,000 |
$5,000 |
$5,000 |
$5,000 |
$5,000 |
$5,000 |
$5,000 |
$5,000 |
$5,000 |
$5,000 |
$5,000 |
$5,000 |
|
Total Current Assets |
$255,000 |
$242,244 |
$199,462 |
$182,058 |
$673,733 |
$649,824 |
$623,861 |
$597,711 |
$566,311 |
$540,348 |
$514,198 |
$482,798 |
$456,835 |
|
Long-term Assets |
|||||||||||||
|
Long-term Assets |
$0 |
$25,000 |
$50,000 |
$75,000 |
$100,000 |
$150,000 |
$200,000 |
$250,000 |
$300,000 |
$350,000 |
$400,000 |
$450,000 |
$500,000 |
|
Accumulated Depreciation |
$0 |
$700 |
$1,400 |
$2,100 |
$2,800 |
$3,500 |
$4,200 |
$4,900 |
$5,600 |
$6,300 |
$7,000 |
$7,700 |
$8,400 |
|
Total Long-term Assets |
$0 |
$24,300 |
$48,600 |
$72,900 |
$97,200 |
$146,500 |
$195,800 |
$245,100 |
$294,400 |
$343,700 |
$393,000 |
$442,300 |
$491,600 |
|
Total Assets |
$255,000 |
$266,544 |
$248,062 |
$254,958 |
$770,933 |
$796,324 |
$819,661 |
$842,811 |
$860,711 |
$884,048 |
$907,198 |
$925,098 |
$948,435 |
|
Liabilities and Capital |
Month 1 |
Month 2 |
Month 3 |
Month 4 |
Month 5 |
Month 6 |
Month 7 |
Month 8 |
Month 9 |
Month 10 |
Month 11 |
Month 12 |
|
|
Current Liabilities |
|||||||||||||
|
Accounts Payable |
$0 |
$40,044 |
$39,474 |
$45,033 |
$55,546 |
$57,599 |
$57,599 |
$63,037 |
$57,599 |
$57,599 |
$63,037 |
$57,599 |
$57,599 |
|
Current Borrowing |
$0 |
$0 |
$0 |
$0 |
$0 |
$0 |
$0 |
$0 |
$0 |
$0 |
$0 |
$0 |
$0 |
|
Other Current Liabilities |
$0 |
$0 |
$0 |
$0 |
$0 |
$0 |
$0 |
$0 |
$0 |
$0 |
$0 |
$0 |
$0 |
|
Subtotal Current Liabilities |
$0 |
$40,044 |
$39,474 |
$45,033 |
$55,546 |
$57,599 |
$57,599 |
$63,037 |
$57,599 |
$57,599 |
$63,037 |
$57,599 |
$57,599 |
|
Long-term Liabilities |
$0 |
$0 |
$0 |
$0 |
$0 |
$0 |
$0 |
$0 |
$0 |
$0 |
$0 |
$0 |
$0 |
|
Total Liabilities |
$0 |
$40,044 |
$39,474 |
$45,033 |
$55,546 |
$57,599 |
$57,599 |
$63,037 |
$57,599 |
$57,599 |
$63,037 |
$57,599 |
$57,599 |
|
Paid-in Capital |
$350,000 |
$350,000 |
$350,000 |
$350,000 |
$850,000 |
$850,000 |
$850,000 |
$850,000 |
$850,000 |
$850,000 |
$850,000 |
$850,000 |
$850,000 |
|
Retained Earnings |
($95,000) |
($95,000) |
($95,000) |
($95,000) |
($95,000) |
($95,000) |
($95,000) |
($95,000) |
($95,000) |
($95,000) |
($95,000) |
($95,000) |
($95,000) |
|
Earnings |
$0 |
($28,500) |
($46,413) |
($45,075) |
($39,613) |
($16,276) |
$7,061 |
$24,774 |
$48,111 |
$71,448 |
$89,161 |
$112,498 |
$135,835 |
|
Total Capital |
$255,000 |
$226,500 |
$208,587 |
$209,925 |
$715,387 |
$738,724 |
$762,061 |
$779,774 |
$803,111 |
$826,448 |
$844,161 |
$867,498 |
$890,835 |
|
Total Liabilities and Capital |
$255,000 |
$266,544 |
$248,062 |
$254,958 |
$770,933 |
$796,324 |
$819,661 |
$842,811 |
$860,711 |
$884,048 |
$907,198 |
$925,098 |
$948,435 |
|
Net Worth |
$255,000 |
$226,500 |
$208,587 |
$209,925 |
$715,387 |
$738,724 |
$762,061 |
$779,774 |
$803,111 |
$826,448 |
$844,161 |
$867,498 |
$890,835 |